Data Center Delay Tracker Update: August 24, 2026
224 tracked projects, 658 local restrictions and 32,326 queue rows, each linked to its primary source.
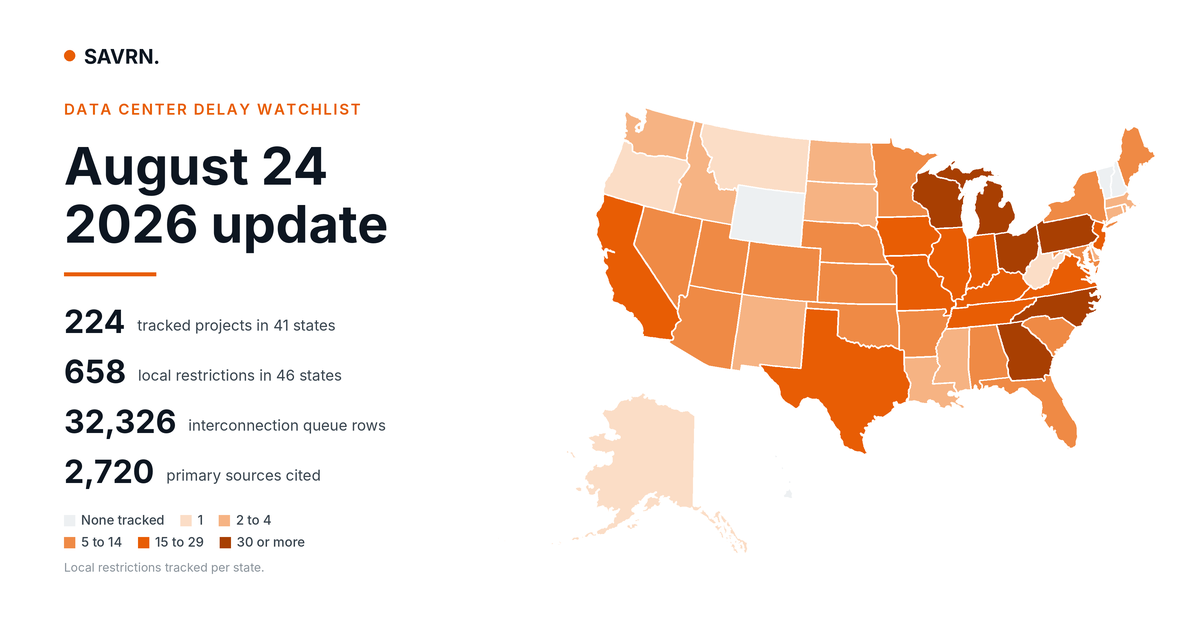
This data center delay tracker update covers the August 24, 2026 refresh of the Nationwide Data Center Delay Watchlist, the record SAVRN keeps of named U.S. projects that have slipped, stalled, or been withdrawn, and of the government and utility decisions behind them. Specifically, it reports what moved since the previous dataset was compiled on August 19, 2026. Importantly, every figure below is computed from the published dataset, and every entry behind it carries a link to its primary source.
Where the count stands
| Section | Previous | Current | Change |
|---|---|---|---|
| Tracked projects | 224 | 224 | 0 |
| Jurisdictional actions | 127 | 127 | 0 |
| Local restrictions | 658 | 658 | 0 |
| Lawsuits | 39 | 39 | 0 |
| Federal actions | 23 | 23 | 0 |
| Utility actions | 227 | 227 | 0 |
| SEC filings | 44 | 44 | 0 |
| Government releases | 17 | 17 | 0 |
| Companies watched | 15 | 15 | 0 |
| Interconnection queue rows | 32,321 | 32,326 | +5 |
| Primary sources cited | 2,717 | 2,720 | +3 |
What changed this period
The section counts did not move. Specifically, the projects, jurisdictional actions, local restrictions, lawsuits, federal actions, utility actions, SEC filings and government releases all carried the same totals forward. However, a flat count is not the same as a quiet period, and this period was not quiet.
Texas put a date on the pause, and moved the one that mattered
The largest development of the period is not a row count. At the Public Utility Commission of Texas open meeting on August 20, 2026, ERCOT set a target of December 10, 2026 to file the verification and audit report ordered by the governor on August 3, one week ahead of the December open meeting where it is expected to be taken up. (PUCT Project 59142)
More consequential than the filing date is what ERCOT said about the other one. The Batch Zero transmission planning study had been targeted for April 9, 2027. ERCOT’s senior vice president of regulatory policy, Chad Seely, told the commission plainly that the study will not be done by that date. (Utility Dive) Because interconnection approvals stay paused while verification runs, roughly 300 data centers of 75 MW or larger sit inside Batch Zero waiting, and even the large loads that already cleared stability assessment must pass through verification before they can be approved to energize.
Consequently, the Texas queue now has two clocks and neither one is short. Verification runs to December at best, and the study that follows it has lost its date entirely. For a project carrying land, equipment orders and a power contract, that is the difference between a schedule and an open question.
This item was verified and added to the watchlist in this edition. It did not come from the automated refresh. Most of what matters on this list does not.
Meanwhile, the interconnection queue moved. Rows went from 32,321 to 32,326, and tracked capacity went from 4,429,447 MW to 4,432,097 MW, a gain of 2,651 MW. Specifically, the movement came from MISO 3,812 to 3,817. In addition, the status mix shifted: active 4,121 to 4,126, study 696 to 698, suspended 107 to 104, withdrawn 15,313 to 15,314.
A note on which sources refreshed
Not every feed returned new data this period. Specifically, the PJM and MISO queues re-pulled cleanly, while the ERCOT, CAISO, SPP, NYISO and ISO-NE row sets carried forward from the previous compile. Therefore the queue totals in this edition are current for two operators and as-of-last-pull for the rest. We would rather publish that limitation than let a partial refresh read as a full one.
What the record shows
Start with the reason projects stall. Across 224 tracked projects, the watchlist records 117 that cite community opposition as a cause of delay. By contrast, 2 cite financing. In fact, that gap is the single most useful finding in the dataset. Because the binding constraint on delivering compute in the United States right now is neither capital nor silicon, it is permission.
The restriction layer is local, and it is new
The watchlist holds 658 local restrictions across 620 distinct jurisdictions in 46 states. Notably, they sit at four levels of government: 281 county, 264 city, 104 township and 9 borough. Of those, 474 are in force, 93 are pending and 91 have expired.
Importantly, the dates matter more than the total. Of the 658 restrictions on the list, 501 carry a 2026 date, compared with 141 in 2025 and 15 in 2024. In other words, most of this rulebook was written in the last eight months. Consequently, a siting assumption made in 2024 is now being tested against ordinances that did not exist when it was made.
Utilities are rewriting the tariff, not just the queue
The watchlist tracks 227 utility actions across 180 utilities in 40 states. Of those, 116 are tariff filings, 15 are rate cases, 17 are special contracts and 7 are integrated resource plans. Notably, 123 remain pending, which means the rules that will govern large-load service in much of the country are still being written.
For example, Georgia shows the shape of it. In January 2025 the Georgia Public Service Commission approved a large-load rule allowing recovery of site-specific generation, transmission and distribution costs, contracts of up to 15 years, and minimum billing requirements for customers above 100 MW. (Georgia PSC) Furthermore, in December 2025 the Commission certified 9,985 MW of new generation, roughly 80 percent of which is expected to serve data centers, with Georgia Power agreeing to backstop the associated costs through 2031. (Georgia PSC data center fact sheet) That is the cost-allocation question being answered in public, one docket at a time.
Litigation has become a normal step
There are 39 lawsuits on the watchlist, and 32 of them were filed in 2026. Of those, 17 plead environmental causes of action and 16 plead zoning, while 31 remain active. Importantly, the suits now run in both directions. Community groups sue to stop projects, and developers sue jurisdictions that stopped them, which is a sign that the land-use fight has matured past the public-comment stage.
Washington has noticed
The federal section holds 23 actions: 13 bills, 6 orders, 2 rules and 2 dockets. The most consequential is the June 2026 set of show-cause orders directing all six RTOs and ISOs to justify or reform their large-load and co-location interconnection tariffs. Because those proceedings reach the interconnection rules themselves, they can move more capacity than any single project decision on this list.
Companies are now saying it out loud
The watchlist carries 44 securities filings from 34 issuers, weighted toward annual and quarterly reports. These are not press releases. Instead, they are the risk disclosures a company signs. For example, CleanSpark’s quarterly report filed August 6, 2026 discloses the August 3 letter from the Texas governor directing ERCOT and the Public Utility Commission of Texas to audit every data center advancing through the state’s interconnection process before it can proceed. (SEC EDGAR) Meanwhile the state’s own large-load interconnection rule is still being written, docketed as Project 58481 at the Public Utility Commission of Texas. (PUCT Interchange) Ultimately, when a delay reaches a risk factor, it has been priced.
The queue is mostly a list of things that did not happen
The national queue view now holds 32,326 rows across 23 operators and utilities, totaling about 4,432 GW of requested capacity. However, 15,314 of those rows, or 47 percent, are withdrawn. By contrast, only 8,099 hold a signed interconnection agreement. Therefore any headline that adds up queue megawatts and calls the total a pipeline is measuring intent, not delivery.
Within that queue, 46 rows are explicitly flagged as data center load and 92 large-load or cluster studies are tracked separately. In fact, that small flagged count is itself a finding. Large load mostly does not enter the public record as “data center,” which is exactly why the study documents matter.
What the delay actually costs
Of the tracked projects, 67 carry a dated first delay, and the median among them is 165 days. A further 58 disclose an investment figure, and those disclosures total about $467 billion. Since the carrying cost of an idle facility does not pause while a zoning question is answered, the schedule is the balance sheet. We walked through that arithmetic in The Queue Was the Fiction.
How this watchlist is maintained
The dataset is refreshed weekly by an automated pipeline that re-pulls the interconnection queues, re-runs a filings and trade-press monitor, and rebuilds the published file. Nevertheless, nothing reaches the public page automatically. Specifically, a signal from the monitor is a lead, not an entry. It becomes an entry only after a person verifies it against a primary source: a commission docket, an ordinance, a court filing, a securities filing, or a government release.
The deploy runs behind floor checks. If a section shrinks by more than a fifth week over week, or falls below its absolute floor, the refresh aborts and the live page keeps the previous data rather than publishing a bad pull. Additionally, the file it replaces is backed up first, so any edition can be restored.
The full dataset, with filters across every section, is at the Nationwide Data Center Delay Watchlist. All 2,720 citations, drawn from roughly 1,225 distinct organizations, are listed at the sources page. For the policy layer underneath these projects, the companion U.S. Data Center Moratorium Tracker records state and local measures on their own timeline.
Want the next one?
When a new piece publishes on SAVRN Insights, you get one email with what it covers and a link to read it. No digests, no promotions.
One email when it publishes. Unsubscribe in one click. Privacy
Frequently asked questions
What is the Nationwide Data Center Delay Watchlist?
It is a primary-sourced record of U.S. data center projects that have been delayed, halted, denied, withdrawn or cancelled, together with the jurisdictional, utility, legal and federal actions behind them. It currently tracks 224 projects, 658 local restrictions and 227 utility actions, each linked to its source.
How often is the watchlist updated?
Weekly. The pipeline runs every Monday morning and this post records what changed. Because a quiet week is still a result, an edition that reports no additions is published the same way as one that reports many.
What changed in the August 24, 2026 update?
The section counts were unchanged and the national interconnection queue grew from 32,321 rows to 32,326, adding about 2,651 MW of requested capacity from the MISO queue. Substantively, though, the period’s development was in Texas, where ERCOT set a December 10, 2026 target to file the governor’s audit report and said the Batch Zero study will miss its April 9, 2027 date.
When will the Texas data center interconnection pause lift?
No date has been set for lifting it. ERCOT told the Public Utility Commission of Texas on August 20, 2026 that it aims to file the verification and audit report by December 10, 2026, and that the verification will take several months but fewer than nine. Interconnection approvals remain paused while that runs, and ERCOT has said the Batch Zero transmission planning study will not be complete by its original April 9, 2027 target.
What is the most common cause of data center delay?
Community opposition, by a wide margin. It appears in 117 of 224 tracked projects, ahead of litigation at 55 and zoning denial at 49. By contrast, financing appears in only 2.
Which states have the most local data center restrictions?
On the current dataset, Michigan with 63, Ohio with 59, Georgia with 41, Pennsylvania with 41, and North Carolina with 33. Restrictions are tracked in 46 states in total.
Does a queue position mean a data center will be built?
No. Of the 32,326 rows in the national queue view, 47 percent are already withdrawn and only 8,099 hold a signed interconnection agreement. A queue position records a request, not a commitment.
How many data center projects are in active litigation?
The watchlist records 39 lawsuits, of which 31 are active and 32 were filed in 2026. Environmental and zoning claims account for most of them.
Are utilities changing how they price large loads?
Yes. The watchlist tracks 116 tariff filings among 227 utility actions across 180 utilities. Most create a separate large-load class with cost-based rates, minimum billing and longer contract terms.
Where does the watchlist data come from?
From primary records: commission dockets, local ordinances and meeting minutes, court filings, SEC filings, ISO and utility queue postings, and government releases. The current edition cites 2,720 sources from about 1,225 organizations, all listed on the sources page.
How is a delay counted?
A project enters the list when a dated public action changes its schedule or status. Delay days run from that first dated action. Where a date cannot be confirmed from a primary source, the entry carries the status without a day count rather than an estimate.