Two receipts, one economy
On the morning I wrote this, a household in Manassas, Virginia opened a $281 electricity bill. The month before, that bill was roughly $100 (Consumer Reports). The homeowner is not a hyperscale operator. He is not training a model. He does not have a rack of GPUs in his garage. As far as the utility is concerned, he is a residential ratepayer in a state where data centers now account for almost 40% of total electricity consumption (Consumer Reports).
The same morning, twelve local governments had moved in the previous seven days to pause or ban data centers within their jurisdictions. Louisville-Jefferson County Metro in Kentucky. Charlestown in Rhode Island. Waxhaw in North Carolina. Bellevue in Wisconsin. Independence County in Arkansas. Seven others (SAVRN Data Center Moratorium Tracker, August 17, 2026 update). One of them, the Cherokee Nation, chose to keep hyperscale off tribal and trust lands entirely. Independence County, Arkansas has no data center proposal pending. Its Quorum Court still adopted the longest local moratorium in the state's history: five years, running through August 2031. The reasoning was that even the possibility of one warrants that much protection for the water supply (SAVRN 2026-08-17 update).
The utility bill and the moratorium ordinance are not separate stories. They are the same story, told from opposite ends of a wire.
That is the story I built SAVRN to tell, and to build for. This essay lays out the full thesis in three claims. Each one depends on the other two.
1. The model is no longer the moat. Frontier closed models and open-weight models have compressed to within roughly four months and eight points of each other on the best available capability index (Epoch AI). Stanford's AI Index measures the top-1-versus-top-10 spread on Chatbot Arena at 5.4 percentage points, down from 11.9%. It puts the closed-versus-open gap at 1.70%, down from 8.04%, in a single year (Stanford HAI AI Index 2025). Intelligence, as a raw commodity, is deflating at 5–10× per year on a capability-adjusted basis (arXiv 2511.23455).
2. The value has moved to the harness. The same frontier model can score 30.91% or 74.55% on the GAIA agent benchmark depending only on what surrounds it (Princeton HAL). On SWE-bench Verified Mini, changing the scaffold moves scores by 34 to 48 points on identical weights (arXiv 2605.23950). Anthropic, the vendor selling the model, has published guidance that the winning implementations "weren't using complex frameworks or specialized libraries. Instead, they were building with simple, composable patterns" (Anthropic). The engineering object is the harness: the loop, the tools, the memory, the evaluation, the enterprise data behind it. The model is the fuel. The harness is the engine.
3. The infrastructure envelope is closing, and the receipt lands at the checkout counter. The SAVRN moratorium tracker, refreshed on August 17, 2026, shows 45 state-level measures across 36 states and 194 local jurisdictions. Three days earlier the count was 44/35/173 (SAVRN Tracker; update). Heatmap News reports more than 500 counties and municipalities now actively restrict or block new data centers. Michigan is cancelling 71% of contested projects, Indiana 56%, and Texas about 17% (Heatmap News). Every one of those refusals compresses the buildable envelope for AI infrastructure. That compression is being priced into PJM capacity auctions, with three consecutive clearings at the FERC cap, the latest at $16.4 billion (PJM Inside Lines; NRG). It is being priced into rate cases like Dominion's November 2025 order, which raised typical residential bills by $11.24 per month while creating a new large-load class (Southern Environmental Law Center). And it is being priced into the CPI itself, where electricity ran 4.2% year over year in the July 2026 print against 3.4% headline (BLS).
So the thesis is not that AI is expensive because of chips. It is not expensive because of models. It is expensive because it needs to touch physical land, physical water, and physical wire. The political entities that own that land, that water, and that wire are, this year, saying no. The cost of every AI-touched service, the price of the chicken, the shoes, the haircut, the car wash, will rise. Not because the intelligence got smarter, but because the intelligence had nowhere to sit.
That is the thesis. What follows is the evidence.
The Model Is No Longer the Moat

The gap the industry does not want to admit is closed
There is one number that ought to end the "model as moat" conversation. Stanford HAI publishes it every year. In January 2024, the performance difference between the best closed-weight model and the best open-weight model on Chatbot Arena was 8.04%. Thirteen months later, in February 2025, it was 1.70% (Stanford HAI AI Index 2025). That is not a rounding error. It is roughly an 80% collapse in the frontier premium.
The same Stanford chapter shows the spread between the top-ranked and tenth-ranked models on the Arena falling from 11.9% to 5.4%. The top-two gap narrowed from 4.9% in 2023 to 0.7% in 2024 (Stanford HAI AI Index 2025). Ten models now sit within statistical shouting distance of one another. On the LMArena text leaderboard as of this writing, ten entries fit inside seventeen Elo points, with overlapping confidence intervals (LMArena). At the top, "which model is best" has become a coin flip.
Look at the US-versus-China axis. That was supposed to be a decade-long strategic advantage. Stanford's Index found that on MMLU the US-China gap fell from 17.5 percentage points to 0.3 points. On MATH it fell from 24.3 to 1.6. On HumanEval it fell from 31.6 to 3.7 (Stanford HAI AI Index 2025). If your strategic thesis was "only one country's labs can make a good model," you have to build a new thesis.
The independent Epoch AI Capability Index tells the same story with a shorter clock. As of January 2026, Epoch measured open-weight models trailing the closed frontier by an average of four months and about eight ECI points. Epoch itself compares that gap to "the gap between GPT-5 and GPT-5.5" (Epoch AI). The specific scores are worth a look because they show how tightly the frontier now clusters. Kimi K2.5 sits at 148.22. MiniMax-M2.5 at 147.44. GLM-5 at 146.62. DeepSeek-V3.2 at 146.46. gpt-oss-120b at 140.79. GPT-5 is at 150.00 (Epoch AI). Five independently developed open-weight models cluster within four points of the leading closed frontier. On a diagram, that does not look like a moat. It looks like a swimming pool.
Every gap the industry called a moat closed inside about a year.
Blue is the earlier measurement, copper the later one. Six spreads from Stanford’s 2025 AI Index, then the Epoch AI Capability Index strip: five independently developed open-weight models sit within four points of the leading closed model.
Epoch's earlier analysis showed the gap at around three months and roughly seven ECI points. It also documented at least one episode of outright parity: "until the release of o1-mini, Llama 3.1-405B was rated on par with … Claude 3.5 Sonnet" (Epoch AI). The gap has oscillated between three and six months rather than widening. So the frontier lead is not a moat. It is a rolling lease, and the rent is paid in months.
When the incumbent open-weights its own model
The clearest single signal that the model layer is commoditizing comes from OpenAI itself. On August 5, 2025, OpenAI released gpt-oss under an Apache-2.0 license. OpenAI stated explicitly that gpt-oss-120b "achieves near-parity with OpenAI o4-mini on core reasoning benchmarks, while running efficiently on a single 80 GB GPU," and that gpt-oss-20b runs on 16 GB (OpenAI). Independent benchmarking by Artificial Analysis scored gpt-oss-120b at 58 on its Intelligence Index. DeepSeek R1 0528 scored 59 and Qwen3 235B 2507 scored 64. gpt-oss-20b came in at 48. Median serving prices for gpt-oss-120b run $0.15/$0.69 per million input/output tokens. o4-mini runs $1.10/$4.40 and o3 runs $2.00/$8.00. Artificial Analysis calls that spread "close to 10x cheaper" (Artificial Analysis).
Read that sequence slowly. The leading closed lab in the world open-weighted a model that runs on a single GPU. It benchmarks at near-parity with one of that lab's own paid tiers. It costs roughly a tenth of the price. A company protecting a moat does not do that. A company that knows the moat has been drained does that, and chooses to sell the water.
The leading closed lab in the world open-weighted a model that runs on a single GPU, at near-parity with one of its own paid tiers, at roughly a tenth of the price. That is a company acknowledging the moat has been drained and choosing to sell the water.
Alibaba's Qwen3 release announced dense and MoE models under Apache 2.0 with 128K context. It benchmarked itself explicitly against "DeepSeek-R1, o1, o3-mini, Grok-3, and Gemini-2.5-Pro" (Qwen release blog). DeepSeek's public price list, even after its August 2026 4× increase, shows v4-flash at $0.22–0.44 per million input tokens with peak and off-peak tiers (DeepSeek). Off-peak discounting on inference is the same billing structure electricity operators use for load balancing. Cloud compute prices spot capacity the same way. When a category adopts spot-priced tiers, the market is telling you something. This is now a commodity.
The deflation rate matters more than the price
The single most quotable number in the Stanford AI Index for 2025 is the 280×. Between November 2022 and October 2024, the cost of querying a model at GPT-3.5 performance dropped more than 280-fold. Hardware costs declined roughly 30% per year over the same stretch (Stanford HAI AI Index 2025). A 2025 arXiv study puts the current rate at 5 to 10× per year to reach a given benchmark. The highest GPQA-Diamond capability bin declined 31× per year. The lowest bin declined only 1.7× per year. In plain terms, deflation is fastest at the frontier, exactly where enterprises are buying (arXiv 2511.23455).
The residual algorithmic contribution, after adjusting for open-weight competition and hardware improvement, is about 3× per year. Whatever advantage a frontier lab holds is being consumed at 3× annually by algorithmic improvement inside its competitors. That includes the open-weight competitors it does not employ.
Sam Altman himself, in conversation with Fed Vice Chair Michelle Bowman, framed the trajectory in plain language: "It does in fact look like we're about to deliver on 'intelligence too cheap to meter.'" He added: "We've been able to drive down the cost of each unit of intelligence by more than a factor of 10 each year for the last five years" (Yahoo Finance). When the CEO of the most valuable AI company on the planet describes his product with an atomic-age utility slogan, the market is pricing the model itself toward zero.
That price does not go to zero in a straight line. Commoditization is not monotonic. Effective August 16, 2026, one day before I wrote this essay, DeepSeek raised its API prices approximately 4× (Engadget). Even after that increase, its V4 Pro output tier at $3.96 per million tokens sits at roughly one-eighth of GPT-5.6 Sol at $30 per million tokens. The absolute prices move. The spread is what a buyer optimizes: the commodity margin between "good enough" and "frontier."
Enterprise buyers are not loyal
The clearest test of whether a market is commoditizing is whether buyers switch. Menlo Ventures' 2025 State of Generative AI in the Enterprise surveyed 495 US enterprise decision-makers between November 7–25, 2025. It reported that Anthropic reached 40% of enterprise LLM spend, up from 24% in 2024 and 12% in 2023. OpenAI's share fell from 50% in 2023 to 27% (Menlo Ventures). Google reached 21%. Llama, Cohere, Mistral, and others reached 12%. Total enterprise gen-AI spend hit $37 billion in 2025, 3.2× the prior $11.5 billion.
A 23-percentage-point share swing in two years is not what a market with real switching costs at the model layer looks like. It is what commodity substitution looks like. If your model is truly differentiated, buyers do not walk 23 points of share out the door in twenty-four months. They stick, because switching is painful. In this market, buyers have found that switching is not painful. The reason is simple. The buyer is not really switching a model. The buyer is switching a supplier of a commodity input to a harness the buyer already built.
That last sentence is Claim II, waiting in the wings.
The strongest counter-argument, and why it does not undo the thesis
The most sophisticated counter-argument to the commoditization thesis comes from Andreessen Horowitz. In its 2025 Enterprise AI report, a16z states flatly that "the enterprise model layer has not become commoditized" (a16z). The firm reports 37% of enterprise respondents using five or more models, up from 29% the prior year. It also notes model costs "coming down by an order of magnitude every 12 months," and it captures buyer quotes like "Gemini is cheap" and "all the prompts have been tuned for OpenAI." The a16z argument is that agentic fine-tuning and workflow embedding create real switching costs. On that view, the earlier "easy come, easy go" attitude toward model swapping is eroding.
This deserves engagement, not dismissal. a16z is right about the pattern and wrong about the conclusion.
They are right that a buyer who has tuned an agent workflow around Claude's tool-use idioms incurs cost to move. The same goes for a buyer who built a retrieval pipeline around a specific model's context handling. They are right that "the model layer" is not undifferentiated in the way that, say, No. 2 fuel oil is undifferentiated.
They are wrong about what that means. The switching cost a16z describes is not created by the model. It is created by the harness, the prompt library, the eval suite, the tool contracts, the memory design, and the retrieval architecture. Those are the parts of the system the buyer built. That is Claim II. The a16z evidence is actually evidence for the harness thesis. Models look sticky because buyers accreted their own switching costs around the model. The model itself is not providing them.
Set that against the same firm's own observation that costs fall by an order of magnitude every twelve months. The a16z position collapses into something simpler: models are getting cheaper very quickly, buyers use several, and buyers are reluctant to abandon their own accumulated tooling. This is exactly what commoditization inside a stack looks like. The commodity layer is model access. The differentiated layer is the harness stack the buyer wraps around it.
What "commodity" actually means for a builder
For us at SAVRN, the practical implication of Claim I is architectural. When we design an AI factory, we do not design it around a specific model vendor's roadmap. We design it around the model layer as substitutable inference capacity. Our Sovereign Private Network thesis is built on this substitutability. We run physically isolated bare-metal GPU nodes. We orchestrate them with Kubernetes, the NVIDIA GPU Operator, and Run:ai. We run local-first open-weight inference through vLLM. Commercial frontier models are reachable only through an explicit, per-turn, user-authorized egress path.
The engineering rule follows from the market fact. If model performance is converging and per-token prices are deflating 5–10× per year, the correct move is not to bet the campus on Anthropic or OpenAI. The correct move is to build the campus so it can source from any of them, or from an on-campus open-weight model. We choose based on the workload, the sovereignty constraints, and the price of the token at that hour. That is not neutrality for its own sake. It is neutrality because the market has told us, in eight independent benchmarks and one 280× cost curve, that the model is a fungible input.
The question then is: what is not fungible?
The Value Has Moved to the Harness

The number that ought to end the argument
If you take only one data point from this essay, take this one.
On the GAIA agentic benchmark, Claude Sonnet 4.5 scores 30.91% when it runs inside HuggingFace's Open Deep Research scaffold. It scores 74.55% inside the HAL Generalist Agent scaffold. Same model. Same task. Same weights. Forty-three points of absolute performance difference, and every one of those points comes from the harness (Princeton HAL).
A 43-point delta on identical weights is larger than the total gain from any single model generation upgrade Anthropic, OpenAI, or Google has shipped in the past two years.
The academic literature is catching up to what practitioners have felt for eighteen months. A 2026 arXiv paper on harness effects held the model fixed, changed only the scaffold, and watched Terminal-Bench 2 pass@1 move from 69.7% to 77.0%. The same paper found up to fifteen points of scaffold-only variation on SWE-bench Verified (arXiv 2605.23950). On SWE-bench Verified Mini, Sonnet 4.5 scored 68% under one scaffold and 34% under another. That is a 34-point swing. GPT-5 Medium ranged from 46% to 12% on the same benchmark. o4-mini varied by about 48 points. Six frontier models landed within 4.9 points of each other on SWE-bench Pro under a standardized SEAL scaffold. Claude Opus 4.5 alone moved from 45.9% to 55.4% just by switching from SEAL to Claude Code as its harness.
The authors' conclusion is the sentence I built SAVRN's entire agent operating system around: "harness-induced variance can substantially exceed model-induced variance."
Change nothing but the scaffold and the score moves by 7 to 44 points.
Each bar is one model on one benchmark. The blue ring is its score in the weaker scaffold; the copper dot is the same model in the stronger one. The 43.6-point GAIA swing on Sonnet 4.5 is larger than any single model-generation upgrade shipped in the past two years.
Put that next to Part I. The models are compressing to within four months of each other on capability. The harness can move performance by 34 to 48 percentage points on the same weights. So the question "where does enterprise value live" is not a mystery. It lives in the harness. It lives in the scaffold. It lives in what surrounds the model.
Anthropic itself is building the argument
The vendor with the most to lose from the harness thesis is the one that sells the model. It has published the harness thesis under its own logo. Anthropic's engineering blog on effective agents opens with an observation drawn from dozens of teams building agents: "the most successful implementations weren't using complex frameworks or specialized libraries. Instead, they were building with simple, composable patterns." It warns that frameworks "create extra layers of abstraction that can obscure the underlying prompts" (Anthropic). The closing line reads like a strategy memo from a company that has diagnosed its own commoditization risk: "Success in the LLM space isn't about building the most sophisticated system. It's about building the right system for your needs."
In its guidance on long-running agents, Anthropic goes further. It describes the Claude Agent SDK as "a powerful, general-purpose agent harness" built from an initializer plus a coding agent. It states directly that "even a frontier coding model like Opus 4.5 … will fall short … if it's only given a high-level prompt" (Anthropic). Compaction alone, Anthropic writes, "isn't sufficient" for long-horizon work. The harness is not optional. The harness is the product.
Anthropic then names the successor discipline. Prompt engineering was the art of writing a good instruction. "Context engineering" is defined as "optimizing the utility of those tokens against the inherent constraints of LLMs" and framed as "the natural progression of prompt engineering" (Anthropic). What the model knows at inference now matters more than which model is running. What it knows depends on how its context is organized. Organizing that context is the buyer's job.
The definitions have quietly moved
Simon Willison's plain-English definitions have become the shared language of practical AI engineering, and they are blunt about where value lives. "An LLM agent runs tools in a loop to achieve a goal," he writes (Simon Willison). In his agentic-engineering guide, a coding agent is "a piece of software that acts as a harness for an LLM." He reduces it to "LLM + system prompt + tools in a loop" (Simon Willison).
Count the components. Model. System prompt. Tools. Loop. Three of the four are built and owned by the buyer, not the vendor. The industry's own definition of its core primitive puts 75% of the surface area outside the model vendor's hands.
Then Anthropic open-sourced the Model Context Protocol on November 25, 2024, and turned that architectural fact into a market standard. MCP is "a universal, open standard for connecting AI systems with data sources" (Anthropic). What MCP standardizes is the tool interface, the boundary between the model and the systems it acts on. Standardizing that boundary commoditizes the model layer above it and elevates the tool layer around it. Storage went through this when SATA was standardized. Messaging went through it with SMTP. Web APIs went through it with REST. Standards move value across the interface, toward whoever owns the substrate on the standardized side. In AI, that substrate is data, tools, and workflow. It is not model weights.
Standards move value across the interface, always toward whoever owns the substrate on the standardized side. In AI, that substrate is data, tools, and workflow. Not model weights.
The revenue is following the argument
Claude Code is a harness, not a model. It passed a $2.5 billion run rate as of mid-2026, doubling since January 1, 2026, inside a broader $14 billion company run rate. Customers spending over $100,000 grew 7×. The company crossed 500 customers spending more than $1 million (Constellation Research). Anthropic then raised a $30 billion Series G at a $380 billion valuation, on the same report.
Read that as a builder. The fastest-growing line item inside the highest-valued private company in AI is a harness. Not a model. A scaffold, a specific composition of loops, tools, and context around the weights. Anthropic could sell only the tokens, and for years it did. What it now sells at a $2.5 billion run rate is the shape of the loop. That is this section's argument written as a general ledger entry.
Glean is an enterprise search and context platform, not a model lab. It announced surpassing $300 million ARR fifteen months after crossing $100 million. Its Fortune 500 customer count nearly doubled year over year, 85%+ of customers deploy across five or more departments, and its weekly DAU/MAU ratio is 45% (Glean). Glean's own tagline states the harness thesis as a business model: "unrivaled enterprise context fuels AI adoption." A company that trained no model and sells no tokens is scaling faster than most model companies. It does one thing well. It organizes the enterprise's own information so the model can find it.
The bottleneck is data readiness, not model quality
McKinsey's surveys are the closest thing enterprise leaders have to consensus data. McKinsey reports that "only 7 percent of companies have fully scaled AI" and that "more than two-thirds of high-performing companies say data is the primary obstacle for enabling AI" (McKinsey).
Two-thirds of the best-performing companies in the McKinsey sample name data as the bottleneck. If the highest return on the marginal dollar were in model access, some of them would name model quality. They do not.
BCG worked from a different but overlapping sample of 1,250+ firms. It found 60% of companies, the laggard group, achieving no material value from AI and only 5% qualifying as "future-built." Future-built firms showed 1.7× revenue growth, 1.6× EBIT margins, and 3.6× three-year total shareholder return (BCG). Every firm in the sample had access to the same models. The dispersion is organizational.
LangChain's State of Agent Engineering surveyed 1,340 respondents from November 18 to December 2, 2025, and published in June 2026. It found 57.3% of respondents running agents in production, rising to 67% at organizations with 10,000+ employees (LangChain). Quality was the top barrier at 32%. Ninety-four percent of respondents had observability tooling. But 22.8% were doing no evaluation at all.
That last gap, 94% observability against 77.2% actual evaluation, is where SAVRN's DNA Factory lives. Watching the loop run is not the same as measuring whether it worked. The gap between observability and evaluation is the harness maturity gap. Closing it is what the harness thesis is for.
What SAVRN builds because of Claim II
I designed the SAVRN Agent Operating System from top to bottom around one fact: the harness, not the model, is the engineering object. Our agents are not standalone containers. They are platform behaviors, with identities, prompts, context bundles, tool permissions, handoff events, costs, and liveness states visible through the SAVRN dashboard. We treat observation as a first-class layer, not an afterthought. If you cannot see the loop, you cannot improve it. If you cannot improve it, the harness thesis is unavailable to you.
Our master context is a synchronization primitive, not a folder tree. The live platform's shared context layer keeps agent outputs aligned across divisions. It replaces the ad-hoc file-system coordination that early agent teams typically fall back on. Exception-driven management routes problems to the responsible party first and escalates only if unresolved. That preserves executive attention for the exceptions the loop cannot resolve on its own. The spec-conflict monitor baselines Drive- and Box-style files and promotes only spec-candidate additions into review, so the governance loop keeps the harness accountable as it grows.
Authority is action-specific, not persona-wide. Synthetic personas disclose that their biographies and credentials are fictional. Regulated outputs require licensed-human review. Payments, product release, filings, emergency shutdown, and other high-impact actions require named human approval. Claims are controlled by evidence state. Economics, engineering outputs, deployment status, compliance, and accessibility claims are labeled as models, targets, designs, or verified facts, so visual polish does not overstate operational readiness.
None of that is a model. All of it is the harness.
My own daily proof is a small executive stack of morning brief, project and deal tracking, financial-model analysis, writing, research, meeting prep, and commitment-tracking agents. I use them on real work, not a slide demo. Team members work through Claude in the SAVRN browser UI, with the agent running server-side against the shared tenant and Memory/Data API. My local Claude Code path connects to that same server backend rather than maintaining a separate local truth. Data-egress authority requires explicit per-turn UI consent. Workflow inference over free text cannot elevate a sovereign-only request to external-approved. The decision and the approving identity are written to the Work Order.
That governance geometry (bounded human approval inside deterministic schemas, tests, state controls, circuit breakers, and independent review) is the target state we call "governance-based autonomy." It is not a promise of what agents will be. It describes the harness that makes agents safely useful, and it is the shape the value moves into as the model becomes a commodity beneath it.
The Sovereign Private Network is the physical extension of the same logic. Enterprise IP flows through the compute layer. If the compute layer is shared public-cloud fabric, the IP is exposed to hyperscaler dependency, subpoena reach, and standard cloud-tier security. If the compute layer is a privately operated rack inside a closed, tenant-controlled network, with tenant-owned keys, campus data residency, and a deny-by-default egress policy, the IP stays inside the harness. That is a physical enclosure, not a marketing frame. It makes the harness thesis defensible against a class of risks the model layer cannot address by itself.
The interim conclusion, restated
Models are converging on capability. They are deflating on price at 5–10× per year. They are increasingly delivered under permissive licenses, even by the labs that pioneered the closed-model business. The revenue is following harnesses. The bottleneck buyers report is data. The variance the literature measures is scaffold-driven. The definitions practitioners use put 75% of the surface area outside the model.
If you are an operator still designing your enterprise AI strategy around which model you pick, you are optimizing the fungible input and ignoring the differentiated system. If you are a policymaker still worried that one company will own AI because it owns one model, you are looking at a moat that was drained sometime in the last twelve months and thinking about the water that used to be in it.
The value is in the harness. The harness runs on infrastructure. And the infrastructure, as Part III will show, is where the fight has moved.
The Infrastructure Envelope Is Closing
The tracker is a receipt, not an opinion
We at SAVRN maintain the U.S. Data Center Moratorium Tracker as a neutral, source-linked record of what governments have actually done. As of the August 17, 2026 refresh, it documents 45 state-level measures across 36 states and 194 local jurisdictions, with 230 primary sources cited (SAVRN Tracker update 2026-08-17). Of the 36 states with a state-level measure, 12 have a restriction in force, 3 are under an active administrative pause, 7 have a measure pending, and 14 saw their most advanced measure fail or be vetoed (SAVRN Tracker).
The 45/36/194 count is only what we have verified against a primary source. Heatmap News uses a broader definition that captures the most severe local constraints: steep setback requirements, impossible noise limits, or outright bans. By that count, more than 500 counties and municipalities are now actively restricting or blocking new data centers, with more than 530 local laws on the books and nearly 190 added since June 1 (Heatmap News). Our tracker is a lower bound. The real number is larger.
The pattern in the data is clear. State moratorium bills mostly die. MultiState identified 14 statewide moratorium bills across 11 states in 2026, and none of them passed its originating chamber (MultiState). NCSL's tracker documents the full field, including proposed bans reaching to 2030 in Vermont, and a 20-MW threshold in Maine that passed the legislature and was vetoed (NCSL). In most cases the states have declined to hand down statewide bans. The cities and counties have not declined. They have accelerated. That is the structural signal. The risk is not one big statewide law. It is five hundred small local ones.
The cancellation rates matter more than the moratorium counts, because cancellation is what actually changes buildable capacity. Heatmap's numbers are stark. Michigan is cancelling 71% of contested data center projects, Indiana 56%, Texas about 17% (Heatmap News). Roughly two out of three proposed data center projects in Michigan are not being built. The gap between announced capacity and delivered capacity is where every AI infrastructure forecast is going to break.
Forty-five state measures, 194 local jurisdictions, 230 sources. And that is the lower bound.
What the SAVRN Data Center Moratorium Tracker had verified against a primary source at publication, next to Heatmap’s broader count of local restrictions and the cancellation rates that actually change buildable capacity.
Thirty-six states have acted on data centers. Twelve of them have something enacted.
Each state is colored by the most advanced state-level measure the SAVRN Data Center Moratorium Tracker has verified against a primary source, as of August 17, 2026. The 194 local jurisdictions sit underneath this layer; a sample from the single week of August 17 is listed on the right. Contiguous states shown; Alaska and Hawaii have no verified state-level measure.
What the moratoria actually say
The interesting story is not that governments are saying no. It is how they are saying no. The shape of the refusal is the shape of the infrastructure future, so I read the ordinances, not the press releases.
New York wrote the first statewide moratorium in the United States. Executive Order 62, signed July 14, 2026, directs the Department of Environmental Conservation to "hold in abeyance all applications for any discretionary permit… for the construction or expansion of a data center" not deemed complete before that date (New York Governor's Office, EO 62). The moratorium runs up to a year and applies to hyperscale facilities of 50 MW or more. It is paired with a Department of Public Service proceeding that would require data centers to pay more or supply their own energy, an Empire State Development community-benefits framework due in 60 days, and Governor Hochul's stated intent to pursue repeal of sales-tax exemptions (Route Fifty). The policy core is simple: "bring your own power, or pay the full cost."
Louisiana wrote that mechanism into an executive order first. Governor Landry's Executive Order 26-058, the "Louisiana Ratepayer and Community Protection Initiative," directs Louisiana Economic Development to set criteria requiring companies to commit to "ensuring large-load customers fully fund the incremental generation, transmission, and infrastructure investments necessary to serve their projects, preventing cost shifts onto existing residential and commercial customers" (Louisiana Governor's Office). Already-certified projects (Meta, Amazon, and others) are exempt. New projects are not.
Kentucky wrote it as a permit denial power. Governor Beshear's August 2026 executive order requires developers to file an energy plan. It directs the Energy and Environment Cabinet to deny permits for projects that would harm air, water, or natural resources. It bars the Public Service Commission from raising utility rates to recover data-center costs. The governor's summary carries the whole order: "If you cannot meet it, you're not coming to Kentucky" (Lexington KY News).
Texas took the opposite approach: keep building, but make the load curtailable. Senate Bill 6 imposes mandatory curtailment on loads of 75 MW or more interconnecting from January onward. It requires mandatory remote shutoff equipment and creates a voluntary demand-response path with 24-hour notice (Utility Dive). NRG's Travis Kavulla, as reported in coverage of the bill, framed the intent bluntly: to ensure large loads are "not drinking the milkshake of all other Texas power customers." Then, in August 2026, Governor Abbott directed PUCT and ERCOT to audit the 1,800+ projects in the interconnection queue before any new data centers may connect to the grid, excluding on-site-power and non-ERCOT projects (SAVRN Tracker). Taken together, the Texas program is one policy. Keep building, but only if the load is curtailable and the interconnection queue has been reconciled to what the physical grid can carry.

Virginia priced the load directly. The 2026–2028 biennial budget imposes a $0.011/kWh electricity consumption tax on data centers, capped at $600M per year and $1.2B per biennium with excess refunded over the two-year budget (Virginia Mercury). Data center load in Virginia was about 5,050 MW in 2024. Dominion's large-load queue stood at 70,000 MW at the end of 2025. A 70 GW queue against a 5 GW installed base is the number that explains every moratorium in this section. Nobody hates data centers. The physical grid cannot absorb a 14× increase in load at the announced schedule, and the political system knows it.
Virginia's own legislative watchdog, JLARC, told the state so in plain terms. Virginia's energy demand was essentially flat from 2006 to 2020. Unconstrained future demand, driven primarily by data centers, would double within ten years (Virginia JLARC Report 598). Meeting unconstrained demand would require doubling 2024's annual solar addition rate, more offshore wind than all secured Virginia sites can produce, gas plant additions at or above the 2012–2018 peak build rate, and reliance on unproven nuclear technologies. Even meeting half of unconstrained demand would require roughly one 1,500 MW gas plant per year for fifteen consecutive years. JLARC did not say it was inconvenient. JLARC said building for unconstrained demand "will be very difficult to achieve."
Oregon regulators went straight to price discrimination. The Oregon PUC unanimously approved a 29.7% rate increase applied only to large loads (data centers, crypto miners, and industrial customers above 20 MW) under the 2025 POWER Act. Residential bills fell 1.3%, roughly $1.91 per month (OPB). That is the template other states will copy: a distinct class, a large differential, and a visible residential benefit. When residents see their bill go down because the data center's went up, the politics of large-load allocation reset.
New Jersey wrote it as statutory law and put data centers first in the curtailment order. The Data Center Fair Share Act (S731/A796) establishes a new ratepayer class and rate structure requiring data centers to pay their own energy and grid infrastructure costs. It mandates that they curtail before residential ratepayers, and it creates a retail capacity-offset program outside PJM. The Governor's announcement framed the savings from the administration's full package of actions, this bill included, at more than $1 billion per year for New Jerseyans (New Jersey Governor's Office).
Five states have converged on a common ratepayer-protection template. MultiState's cross-state analysis puts the trigger thresholds side by side: Alabama SB 270 (150 MW), Tennessee HB 1847 (50 MW), South Dakota SB 135 (10 MW), Nebraska LB 1010 (20 MW), Florida SB 484 (50 MW) (MultiState). Each statute assigns grid-expansion costs to the large load. South Dakota's 10 MW trigger is low enough to sweep in mid-size enterprise and edge deployments, not only hyperscale. A hyperscale-only framing of "bring your own power" is now obsolete. The MW threshold is dropping.
Georgia built a multi-year framework. The PSC required Georgia Power to file cost-allocation studies ensuring data centers pay total costs and that data center revenue would reduce rather than increase residential bills. It approved minimum billing requirements and longer contract terms, approved large-load price structure changes, and froze base rates through 2028. On December 19, 2025, it certified 9,985 MW of new generation, with Georgia Power agreeing to financially "backstop" those costs through 2031 if data center contracts fail to materialize (Georgia PSC). Ten gigawatts of new generation with a utility-backstop obligation if the data centers do not show up. That is not a moratorium. It is a bill of materials.
Ohio's approved AEP tariff is what "pay for what you reserve" looks like in tariff language. Schedule DCT, adopted by PUCO on July 9, 2025 and effective July 23, 2025, sets minimum billing demand at no less than 85% of the highest prior monthly billing demand over eleven months. For customers between 25,001 and 75,000 kW of contract capacity, minimum demand is 15,000 kW plus 85% of capacity above 25,000 kW. Above 75,000 kW it is 57,500 kW plus 100% of capacity above 75,000 kW, capped at 85% of total contract capacity. Load ramp minimums run 50%/65%/80%/90% across years one through four, with an initial term equal to the ramp period plus eight years (AEP Ohio). That is a tariff written by a utility that has looked at 70 GW of speculative interconnection requests and decided the industry pays for what it books.
Ten jurisdictions, one instruction: fund your own power, your own grid, your own risk.
None of these is a classical moratorium. Each is the same rule in a different jurisdictional voice, and each is a template another commission can copy.
| Jurisdiction · instrument | Mechanism | Trigger |
|---|---|---|
| New YorkExecutive Order 62, July 14, 2026 | First statewide moratorium; up to one year; hyperscale 50 MW+; DPS proceeding to pay more or supply own energy | 50 MW |
| LouisianaExecutive Order 26-058 | Large-load customers fully fund incremental generation, transmission and infrastructure; certified projects exempt | cost recovery |
| KentuckyExecutive order, August 2026 | Energy plan required; Cabinet may deny permits; PSC barred from raising rates to recover data-center costs | permit denial |
| TexasSenate Bill 6; PUCT/ERCOT audit | Mandatory curtailment and remote shutoff for 75 MW+; 1,800+ queue projects audited before connection | 75 MW |
| VirginiaSCC order, Nov 25, 2025; 2026–28 budget | GS-5 class from Jan 1, 2027 at 25 MW: 14-year contracts, 85% T&D and 60% generation minimums; $0.011/kWh consumption tax | 25 MW |
| OregonPUC under the 2025 POWER Act | 29.7% rate increase for loads above 20 MW; residential bills down 1.3% | 20 MW |
| New JerseyData Center Fair Share Act (S731/A796) | New ratepayer class pays own energy and grid costs; curtails before residential; savings framed at $1B+ per year | new class |
| GeorgiaPSC framework; Dec 19, 2025 certification | Cost-allocation studies, minimum billing, longer terms; 9,985 MW certified with utility backstop through 2031 | 9,985 MW |
| Ohio (AEP)Schedule DCT, effective July 23, 2025 | Minimum billing demand 85%; ramp minimums 50/65/80/90%; term = ramp plus eight years | 85% min bill |
| AL · TN · SD · NE · FLRatepayer-protection statutes | Grid-expansion costs assigned to the large load at 150 / 50 / 10 / 20 / 50 MW triggers | 10–150 MW |
Case study: the Prince William County failure and what it taught the rest of America
Every noise ordinance in this section is being written in 2025 and 2026 because of a specific failure in Prince William County, Virginia. Amazon's Tanner Way data center sat next to the 291-home Great Oak community. Residents described the noise as "catastrophic," reported sleep deprivation, and organized. When they went to their county government for relief, they discovered that the county's 1989 general noise ordinance had excluded air-conditioning noise. In 1989, presumably, nobody anticipated an industrial-scale HVAC installation less than a football field from a bedroom window. The result, as Data Center Dynamics reported, was that "the County has no legal ability to control noise at any level from data center cooling equipment" (Data Center Dynamics).
Read that sentence as a policy-drafting brief. A county with an old ordinance that did not anticipate industrial cooling has no legal tool to protect residents from industrial cooling. Every county in North America that has watched that scenario has since amended its noise ordinance or is in the process of amending it. Edgecombe County's 60 dBA property-line rule is a direct response. York County's dBC-and-octave-band requirement is a direct response. Chandler, Arizona's 7-0 rejection of a data center after "public opposition over noise, water and quality-of-life concerns" is a direct response (SAVRN Tracker). So are Chandler, Denver, Boulder County, Broomfield, Larimer County, Monument, and Woodland Park in Colorado, all in the tracker with In Force status.
The operational lesson for anyone building AI infrastructure is this. The political trigger is not the actual noise level. The trigger is the legal inability of the county to control the noise level. Once residents in one jurisdiction discover that inability, every neighboring jurisdiction pre-empts it by ordinance. The failure at Prince William County was one facility. The regulatory response is now hundreds of facilities' worth of design constraints.
The three physical constraints, in ordinance text
Behind the ordinance count, the moratoria cluster around three physical constraints. Together they form the hard envelope. That is the constraint set SAVRN, and any responsible AI infrastructure operator, has to design against.
Constraint one: noise, expressed as decibel limits at the property line. Edgecombe County, North Carolina adopted text amendment TA-25 on November 3, 2025. It requires projects be "engineered so as not to exceed 60 dBA measured at the project property line," with county-selected third-party verification at the applicant's expense, plus water and electrical capacity attestations. Staff had originally proposed 60 dBA daytime and 50 dBA nighttime (Citizen Portal, Edgecombe County). Property-line compliance at 60 dBA, verified by a third party the applicant pays for, is not a paperwork constraint. It is a design constraint on the cooling system.
York County, Pennsylvania's data center model ordinance sets CNEL at or below 60 dBA at sensitive-receptor boundaries and 70 dBA at other developed property. It applies +5 dB evening and +10 dB night penalties, and it requires a full sound study including dBC and octave-band analysis (York County). Requiring dBC and octave-band data is a sophistication marker. Local regulators have figured out that A-weighting hides the low-frequency tonal hum that ordinary residents find intolerable, and they are drafting to that. A data center whose cooling produces even a moderate low-frequency "growl" cannot pass a dBC test at 60 dBA nighttime, even if it can pass a dBA test.
Every ordinance in this cluster is defensive drafting against the Prince William County failure described above. The Environmental and Energy Study Institute puts the health-effects layer plainly: noise above 85 dB is harmful, above 65 dB raises stress and blood pressure, data centers can reach 96 dB, and diesel generators can hit 105 dB (EESI). EESI also notes that Prince William County data center noise "routinely exceed[s] 60 decibels" and that cooling accounts for roughly 40% of data center electricity. That is why noise, thermal design, and power are the same problem seen from three sides.
Constraint two: water, in ordinance language and in academic evidence. The academic reference case is "Making AI Less Thirsty." It states that "training the GPT-3 language model in Microsoft's state-of-the-art U.S. data centers can directly evaporate 700,000 liters of clean freshwater, but such information has been kept a secret." It projects global AI water withdrawal at 4.2 to 6.6 billion cubic meters in 2027, "more than the total annual water withdrawal of 4-6 Denmark or half of the United Kingdom" (arXiv 2304.03271). NCSL identifies three converging trends in state law: tighter pre-permit water-supply demonstration, mandatory reporting, and efficiency/technology requirements (NCSL). The specific bills track. Virginia HB 496/SB 553 (effective January 1, 2027) requires monthly potable and reclaimed volume reporting. California AB 1577 requires monthly reporting to the CEC including water usage effectiveness. Iowa HF 2447/HF 2690 requires quarterly reports with source, total input, and WUE. South Carolina H 4583, the "Data Center Responsibility Act," writes closed-loop liquid cooling requirements and limits on public incentives into law. Illinois SB 2181 requires annual reporting plus a ratepayer-impact study. Georgia SB 421 bars NDAs that conceal electricity or water usage.
Set against the ordinance text, this is not a data-collection request. It is a design constraint. If South Carolina requires closed-loop cooling by statute, the water-cooled tower is no longer an option for a South Carolina facility. The cost of moving to direct-to-chip or two-phase immersion is baked into the site.
Constraint three: bring your own power. Louisiana wrote it as executive language ("large-load customers fully fund the incremental generation, transmission, and infrastructure investments"). New York wrote it as executive-order policy ("pay more or supply their own energy"). New Jersey wrote it into statute (a separate class that curtails before residential). Oregon wrote it as a 29.7% differential rate. Texas wrote it as mandatory curtailability plus interconnection audit. The five ratepayer-protection states standardized MW thresholds and cost allocation. AEP Ohio's Schedule DCT wrote it as a take-or-pay minimum billing demand and a load-ramp minimum.
None of these is a "moratorium" in the classical sense. All of them are the same instruction in different jurisdictional voices: if you want to run a data center here, you fund your own power, your own grid upgrades, and your own risk of interconnection failure. If you cannot, you are not welcome.
None of these is a moratorium in the classical sense. All of them are the same instruction in different jurisdictional voices: if you want to run a data center here, you fund your own power, your own grid upgrades, and your own risk of interconnection failure.
The global precedent: moratoria become permanent standards
Any developer telling themselves the current wave will pass should look at the European history. Amsterdam and Haarlemmermeer announced a data center ban on July 12, 2019 (Data Center Dynamics). They lifted it in 2020, with PUE requirements of 1.2 for new build and 1.3 for existing facilities. In December 2023, additional fresh-energy restrictions were added. The Netherlands now bars projects of 70 MW or more IT capacity and over 10 hectares in most of the country. No new capacity came online in Amsterdam in Q1 2024. The Dutch Data Center Association dismissed the rules as "symbol politics," which is what an industry says when it has lost the argument.
Singapore paused new data center development from 2019 for two years. Trade and Industry Minister Gan Kim Yong confirmed resumption in a written parliamentary answer. He said the government would be "more selective" and would seek facilities "best in class in terms of resource efficiency." Market sources cited by Mingtiandi suggested new sites might be limited to around 5 MW (Data Center Dynamics). Singapore's context: about 70 data centers, roughly 1,000 MW, ~7% of national electricity, 96% of power from natural gas. When a country whose data center economy is 7% of its electricity paces new capacity in 5 MW increments, policy has reset the market.
Ireland's grid operator, EirGrid, stated that it will accept no new data center connection applications in the Dublin region, possibly until 2028, following CRU decision CRU/21/060. It described Dublin as "a constrained area" that "will remain so for the foreseeable future," with data center load potentially reaching 30% of Irish electricity by 2030 (Data Center Dynamics). The refusal is not zoning. It is grid-side. The wire will not accept the load.
Put the three cases side by side. Amsterdam's ban did not end; it converted into permanent PUE and capacity limits. Singapore's pause ended with selective allocation and 5-MW effective ceilings. Ireland's refusal happened at the wire, not the property line. The pattern is consistent. Temporary moratoria settle into permanent performance standards. American operators expecting the current wave to pass without leaving a permanent design constraint behind should compare notes with their counterparts in Dublin and Rotterdam.
The subsidy critique that fuels local opposition
The political engine behind local moratoria runs on a specific number. It is worth quoting because it shows up in council testimony across the country. Good Jobs First's Money Lost to the Cloud report identifies "11 data center megadeals with the average cost per job of $1.95 million." It documents that Google, Apple, Microsoft, Facebook, and Amazon Web Services collectively "have been awarded more than $2 billion" in state and local subsidies, and it covers data-center-specific tax exemption programs in 27 states (Good Jobs First). $1.95 million per job is what a resident hears at a public hearing. When the subsidy per job is higher than the median lifetime income in the county, the political math for the local commissioner is not complicated.
That number is why the tax-incentive rollbacks in the tracker are as important as the moratoria. Arizona's FY2027 budget paused new data center sales-tax exemptions for three years (SAVRN Tracker). Florida's HB 7031 raised the exemption threshold from 15 MW to 100 MW with no grandfather clause (SAVRN Tracker). Iowa's HF 976 added expiration dates to previously indefinite exemptions. Washington's ESSB 6231 ended the exemption for replacement equipment and refurbished-facility centers. Nebraska's EO 26-17 barred new data center applications from ImagiNE Act incentives. Illinois paused new tax-incentive deals by executive directive. Ohio paused new sales-tax exemption requests pending legislative study. That exemption cost about $1.6 billion in 2025.
Taken together, the state legislatures are sending one message. The era of "give us the data center, we will give you the tax exemption" is ending. The next era's price to the operator is: build the plant, pay the tax, meet the standards, and prove the community benefit. Or build somewhere else.
The 8/17 week: what a normal week now looks like
The August 17, 2026 tracker update logs a week that would have been extraordinary in any prior year. Now it qualifies as ordinary (SAVRN Tracker update 2026-08-17). New Mexico legislators announced they will introduce a statewide moratorium bill in January 2027. Independence County, Arkansas adopted a five-year moratorium running through August 2031, the longest in Arkansas, citing water supply strain, with no data center proposed in the county. Louisville-Jefferson County Metro, Kentucky, voted 24-1 for a six-month moratorium, amended on the floor to also cover conversions of existing buildings. Nicholasville, Kentucky passed a six-month moratorium, citing utility cost, property tax, and water-consumption concerns. Greensboro, North Carolina held a hearing on a 120-day moratorium for 10 MW+ facilities. Waxhaw, North Carolina voted unanimously for a 12-month halt covering data centers, crypto mining, and related digital infrastructure. Yadkin County, North Carolina held a hearing on a one-year moratorium. Conneaut, Ohio narrowly rejected a one-year moratorium 2-4 on third reading, but a separate 25 MW cap remains under consideration. The Cherokee Nation announced it will not permit hyperscale data centers on tribally owned or trust lands. Charlestown, Rhode Island voted 5-0 to prohibit data centers and battery energy storage systems townwide, citing reliance on well water and septic systems. Bellevue, Wisconsin voted unanimously for a 12-month moratorium extendable by six months.
That is one week. Twenty-one local jurisdictions gained a new entry on the tracker, counting new activity plus newly verified older activity. Three primary states (North Carolina, Kentucky, Wisconsin) picked up multiple entries. A tribal government joined the list, a jurisdictional class that had barely appeared before. Two of the entries, Waxhaw and Independence County, were adopted with no data center project even proposed. The data center did not provoke the moratorium. The possibility of a data center provoked the moratorium. That is a threshold shift in political posture, not a case-by-case reaction.
Now do the arithmetic. If a normal week produces 12 new local entries and 1 new state-level entry, and Heatmap's broader count already sits above 500, the trajectory is toward 700 to 1,000 local jurisdictions with restrictions inside twelve months. Add the state-level rate-class statutes, the tax-incentive rollbacks, and the interconnection audits. Every AI infrastructure operator now designs against a stack of overlapping constraints rather than a single one. That stack is what we at SAVRN call the buildable envelope. The envelope is closing.
The Receipt Lands at the Checkout Counter
The dispatch model that names the number
There is a working paper from the Federal Reserve Bank of Dallas that does the arithmetic the industry does not want to do. Kay, Reaser, and Taylor's March 2026 study builds an hourly, unit-level least-cost dispatch model of continental U.S. wholesale markets. It finds that "existing data centers have already increased wholesale prices by 3 to 5% on average nationwide, with substantially larger effects in regions hosting major data center corridors" (Dallas Fed WP 2606). Extended to 2028 under proposed construction, the high-utilization scenarios raise wholesale prices by 50%. A more moderate build-out yields about 20%. Their framing line ought to appear in every AI infrastructure investor deck for the next three years: "Artificial-intelligence-driven data centers are reversing two decades of flat U.S. electricity demand and have generated questions about how this growth will impact electricity prices."
Look at the range. Three to five percent nationwide today, before the announced build-out has been built. Twenty to fifty percent to come, depending on how much of that build-out gets delivered. This is a modeled result from a Federal Reserve working paper, not a "possible risk." And it is happening on the wholesale side of the meter, which is where residential rate cases source their inputs.
The PJM auction: three cap-hits in three years
The clearest single price signal in U.S. power markets is the annual PJM capacity auction. It sets the price at which generators commit capacity for the delivery year three years out. For the 2025–2026 delivery year, capacity cleared at $269.92/MW-day, up from $28.92 the year before (Reuters). The BGE and Dominion zones cleared at $466.35 and $444.26/MW-day respectively. The 2026–2027 auction hit the FERC-approved ceiling of $329.17/MW-day PJM-wide, a 22% increase for most zones.
The 2027/2028 auction, announced December 17, 2025, cleared at $333.44/MW-day UCAP across the entire footprint, up 1.3%. That is the FERC-approved cap. Total cleared value was $16.4 billion, securing 134,479 MW of UCAP (PJM Inside Lines). Only 774 MW UCAP of new generation and uprates cleared. The supply response is negligible. The auction failed both its reliability requirement and its market-power test at the same time. The RTO failed the Three-Pivotal-Supplier market structure test, which triggered mitigation on all existing generation (PJM 2027/2028 BRA Report).
The 2028/2029 auction cleared at the cap again, $325/MW-day UCAP across all LDAs. It procured 138,318 MW UCAP against a 156,013 MW reliability requirement. Shortfall: 6,831 MW. Reserve margin: 14.7%. New generation and uprates cleared: 525 MW (NRG).
Three consecutive auctions at the cap. A regulatory ceiling is not a market price. FERC docket ER25-1357 approved a cap-and-floor collar spanning 2026/27 through 2029/30, in coordination with the governors of all 13 states in the PJM footprint. PJM itself stated that the collar "may reduce volatility but do[es] not solve the underlying supply-demand imbalance." Whatever the market would clear at without the collar is higher than what it is clearing at now. The gap between the administratively suppressed price and the true clearing price is a debt. It will be paid, and it will be paid on residential rate cases.
The customer count matters. PJM covers 67 million people across 13 states plus D.C. When a capacity auction clears at the cap three years in a row, 67 million people are on the wrong side of a supply curve.
PJM capacity: from $28.92 to the regulatory ceiling, three delivery years in a row.
Clearing price per MW-day for the market that serves 67 million people. Copper bars cleared at the FERC-approved cap. A capped price is not a market price; whatever the market would clear at without the collar is higher.
The load forecast that broke six-fold in three years
If you want a single number to explain everything else in this section, it is this one. Grid Strategies' November 2025 report finds that the five-year nationwide summer peak growth forecast has risen from 24 GW (2022) to 38 GW (2023) to 64 GW (2024) to 166 GW (2025). "Over the past three years, the 5-year forecast of utility peak load growth has increased by more than a factor of six, from 24 GW to 166 GW," with annual growth rates rising "more than four-fold, from 0.8% to 3.7%" (Grid Strategies). Aggregated summer peak demand runs 829 GW in 2025, climbing to 995 GW in 2030. The report offers the analogy that turns the number into a picture: 166 GW is "equivalent to adding 15 times the peak load of New York City."
Fifteen New York Cities of peak load. In five years. The physical grid does not add fifteen New York Cities of firm capacity in five years. It has never done that in any five-year window in its history. The gap between the demand forecast and the deliverable supply is where the moratoria are being written, where the rate cases are being filed, and where the checkout-counter receipts are being generated.
The five-year peak-load growth forecast rose six-fold in three years.
Grid Strategies’ nationwide five-year summer peak growth forecast, by the year it was issued. 166 GW is the equivalent of adding fifteen times the peak load of New York City. Annual growth rates rose from 0.8% to 3.7%.
Berkeley Lab's federally mandated study is the reference dataset. It puts the U.S. data center share of national electricity at 11.8% by 2030 in its central scenario, with a range of 9.5% to 15.3% (LBNL). The IEA's global figure has data centers moving from about 415 TWh in 2024 (roughly 1.5% of global electricity) to around 945 TWh by 2030, "slightly more than Japan's total electricity consumption today," with a 700-1,700 TWh range for 2035 (IEA Energy and AI, Executive Summary). The U.S. accounted for 45% of 2024 global data center consumption. China 25%. Europe 15%. A typical AI-focused data center consumes as much electricity as 100,000 households. The largest under construction will consume 20 times that. An AI data center is 10 times more capital-intensive than an aluminum smelter.
Goldman Sachs Research's Six Ps report projects data center power demand up 175% by 2030 versus 2023 levels, "the equivalent of adding another Top 10 power consuming country" (Goldman Sachs).
The macroeconomic pass-through
Goldman's macro team then made the pass-through explicit. In February 2026, analyst Manuel Abecasis told clients electricity prices rose 6.9% year over year in 2025 against 2.9% headline inflation. That is more than double. He projected an additional 6% household increase through 2027, slowing to 3% in 2028. Data centers, Goldman estimated, account for 40% of electricity demand growth. The macro effects: consumer spending growth down 0.2% through 2027, GDP growth slowed by 0.1%, and core inflation raised by 0.1% through 2027 and 0.05% in 2028, "as businesses pass on higher costs to consumers" (CNBC).
That last clause is the whole point. Goldman is not speculating. Goldman is describing what businesses do. When a supermarket pays more for refrigeration, the price of chicken rises. When a laundromat pays more for water heating, the price of a wash rises. When a car wash pays more to run its vacuum motors and its blower dryers, the price of a car wash rises. Goldman put those effects into a single macro estimate. Businesses will pass higher electricity costs on to consumers.
BLS confirms it in the July 2026 print. CPI all items rose 3.4% over twelve months. Energy services rose 4.3%. Electricity rose 4.2%, eight-tenths of a point above headline (BLS). The gap between electricity and the general index is the wedge Goldman modeled, arriving on the utility bill.
Bloomberg ran a node-level analysis using Grid Status locational marginal pricing across 25,000 nodes in seven RTOs. In areas near data center activity, wholesale prices had risen "as much as 267% for a single month" compared to five years earlier. The price-increase nodes cluster near data centers. Dominion forecast Northern Virginia peak demand rising more than 75% by 2039 with data centers, versus 10% without (Bloomberg).
That last comparison, 75% against 10%, is the cleanest statement of what happens with and without data centers in one service territory. Data centers are not causing all electricity price growth. They are causing a specific, measurable, order-of-magnitude increase in growth on top of the baseline.
The household version
Consumer Reports profiled John Steinbach of Manassas, Virginia. His January 2026 electricity bill hit $281 after he paid roughly $100 the prior month. U.S. residential electricity prices rose 7.1% in 2025, more than twice inflation, and topped 20% in some states. Virginia data centers accounted for almost 40% of Virginia's total electricity consumption in 2024 (Consumer Reports).
The key quote in the piece comes from Harvard Law School's Ari Peskoe: "Utilities are building infrastructure, and then we all pay for it because that's how the utility business model has always worked." I would not call that a policy failure. It is the utility business model working exactly as designed. The utility pays the capital cost to serve the load. The utility recovers the capital cost from rate classes. If the state does not create a distinct large-load class that pays its own way, the residential ratepayer picks up the tab. That is what the Fair Share Act, the Ratepayer and Community Protection Initiative, Schedule DCT, the POWER Act, and Georgia PSC's cost-allocation orders are all trying to prevent.
“Utilities are building infrastructure, and then we all pay for it because that’s how the utility business model has always worked.” Ari Peskoe, Harvard Law School, to Consumer Reports.
Steinbach's own words at the household scale are the second quote worth keeping: "It's just so far beyond any bill that I've ever had… They're building them like it's 'Field of Dreams', build it and the electricity will come, but we don't see how that's going to happen."
That is a Virginia homeowner describing his experience of the load forecast Grid Strategies published in aggregate.
Case study: Dominion's November 2025 rate case
The Virginia SCC's November 25, 2025 final order in Dominion's rate case is worth walking through in detail. It is the clearest single example of how the transition from "utility builds, everyone pays" to "large loads fund what large loads need" gets executed in practice, in one order, at one commission, in one state, and in dollar terms (Southern Environmental Law Center).
Start with the ask. Dominion Energy Virginia filed for revenue increases of $822 million for 2026 and $346 million for 2027, at an ROE of 10.4%. The commission granted $565.7 million for 2026 and $209.9 million for 2027, at an ROE of 9.8% (SELC). Total allowed recovery: $775.6 million against a roughly $1.2 billion request. Typical residential bill impact: $11.24 per month in 2026, plus $2.36 in 2027. Call it about $16 per month higher. That brings the typical residential bill to approximately $165 per month, according to Inside Climate News's reporting on the same order (Inside Climate News).
The dollars are not the interesting part. The interesting part is what the commission did with the shape of the recovery. It approved a new large-energy-user rate class, GS-5, with "much stronger financial requirements," beginning January 1, 2027. The class captures data center customers at 25 MW demand and 75% load factor. Since 25 MW is roughly the smallest AI-relevant training or inference cluster, that sweeps in every hyperscale and enterprise AI facility on Dominion's system. The class requires 14-year contracts. It requires payment of a minimum of 85% of transmission and distribution costs, and a minimum of 60% of generation costs of contracted need. The commission also ordered Dominion off its previous "average and excess" generation cost allocation methodology and directed alternative transmission cost allocations in the next rider proceeding.
Read that as an engineering spec for a data center financial model. A 14-year commitment at a 60% generation cost minimum and an 85% T&D cost minimum, on a class that starts at 25 MW, is a hard floor on the operator's electricity opex. It is also a hard floor on the utility's revenue exposure. Neither side can walk away.
The Piedmont Environmental Council objected to the order. PEC argued for 20-year terms and calculated that 61% of grid-upgrade costs would still fall on individual ratepayers even after the 14-year GS-5 commitments run their course (Inside Climate News). PEC's argument works as a stress test of the political economy. The environmentalists call the recovery too weak. The utility calls it too strong. The commission split the difference by granting roughly two-thirds of the requested revenue, at 55 basis points below the requested ROE, while creating a first-of-its-kind class. That is a template other commissions will copy, and it will get tighter with each iteration.
Step back and the order is a decision architecture. The regulator raised residential rates, created a large-load class, imposed 14-year commitments and minimum cost recovery, and ordered a change in cost allocation methodology. That is the transition mechanism from "utility builds, everyone pays" to "large loads fund what large loads need." It is not free. Residential bills went up. But the slope of future increases changed, because the marginal MW of new load is now on a class that pays its own way.
My reading of the Dominion order is that it defines the price of admission for the next decade of large-load siting in a PJM state. The price is a 14-year signed contract, a minimum bill for both T&D and generation, and an obligation to sit inside a class that pays disproportionately for future grid expansion. That is not a moratorium. For anyone who came to the market planning to move gigawatts of speculative capacity fast, it is worse than one. The Dominion order forces the operator to commit to the load, price the commitment into the AI-service contract with the end customer, and hold that commitment for 14 years.
That requirement is why we built the SAVRN AI Factory Financing Stack around long-tenor construction, CTL/RVI, and taxable bond takeout, and not around short-tenor private credit that assumes flexibility. The financing structure is the financial-model expression of the Dominion GS-5 obligation. It is also why our target counterparties are R1 universities and municipalities. Their credit horizons naturally match the 14-year commitment window, and their political durability makes those commitments defensible in downside scenarios.
Dominion’s November 2025 rate case: what the utility asked, what it got, and the class it created.
The Virginia SCC granted roughly two-thirds of the revenue request, at 55 basis points below the requested return, and created GS-5, the first large-load class of its kind. The right-hand column is the price of admission for large-load siting in a PJM state.
Revenue and return
2026 revenue: $822 million requested → $565.7 million granted
2027 revenue: $346 million requested → $209.9 million granted
Return on equity: 10.4% requested → 9.8% granted
Total allowed recovery: about $775.6 million against a roughly $1.2 billion request
Typical residential bill: +$11.24 per month in 2026, +$2.36 in 2027, to about $165
The large-load class
Threshold: 25 MW demand at 75% load factor
Term: 14-year contracts
Minimum payment: 85% of transmission and distribution costs; 60% of generation costs of contracted need
Methodology: Dominion ordered off “average and excess” generation cost allocation; alternative transmission allocation in the next rider proceeding
Objection on record: Piedmont Environmental Council argued for 20-year terms and calculated 61% of grid-upgrade costs would still fall on ratepayers
The counter-arguments, and why the pass-through remains
A serious essay engages the strongest opposing evidence. There are two credible sources arguing that data centers are not the cause of consumer rate increases.
The first is E3's May 2026 whitepaper, funded and pre-publication reviewed by the Data Center Coalition. E3 argues that electricity rates reflect multiple interacting factors, including inflation raising labor, materials, and financing costs, and natural gas price volatility between 2019 and 2025, and "not load growth alone" (E3). Data Center Coalition funding does not make the whitepaper wrong. It does raise the bar for independent verification.
The second is a June 2026 paper by Watten, Bistline, and Blanford. It uses an instrumental variables approach to estimate that data centers caused average U.S. retail electricity rates to fall modestly over 2015–2024. The authors attribute the effect to large existing fixed costs, economies of scale in transmission and distribution, and declining generation unit costs (arXiv 2606.19777). The paper cautions explicitly that "future supply constraints could reverse the effect."
Both citations deserve engagement, and both can be reconciled with the thesis without contortion. The Watten paper looks backward through 2024. In that window, U.S. data centers had grown, but they grew into a system with slack generation capacity, declining renewable and gas capital costs, and scale economies in transmission and distribution that lowered per-kWh delivered cost. The paper's finding is consistent with that historical picture. The paper's own caveat, that future supply constraints could reverse the effect, is precisely the transition described by Grid Strategies' six-fold forecast increase, JLARC's "very difficult to achieve" finding, PJM's three consecutive cap clearings, and the Dallas Fed's estimate of 3 to 5% today and 20 to 50% by 2028.
Put the two together. Historical scale economies were real, and forward-looking capacity scarcity is what changed. The E3 argument is directionally weaker because it treats data centers as one factor among many without conceding that the marginal factor over the next five years is data center demand. Grid Strategies documented exactly that. The six-fold jump in the five-year forecast is not a distributed contribution. It is concentrated on large loads, principally data centers and, secondarily, factory reshoring.
The synthesis: the past decade of data center growth was compatible with flat or falling retail rates because it happened inside a slack system. The next decade will not be, because the forecast has broken the system's scale. The historical evidence does not disprove the pass-through thesis. It clarifies the discontinuity.
The AI-service pass-through: from utility bills to product prices
Once electricity costs enter the general price level, they arrive at the checkout counter through two channels: the direct utility bill, and the price of everything the utility bill supports. AI-touched products have a third channel that ordinary electricity-consuming products do not. The AI product itself is being priced by usage, not by seat.
Salesforce lists Agentforce at $2 per conversation for external-facing customer agents, $500 per 100,000 Flex Credits (fungible across Actions, Prompts, Translations, and Voice Actions), a $5 per user/month Agentforce User License, $125 per user/month Agentforce add-on tier, $2 Help Agent Resolutions, and $0 for Salesforce Foundations (Salesforce). Unused Flex Credits do not roll over. Exceeding entitlement bills at the contracted rate monthly in arrears. Non-rollover credits with in-arrears overage is a utility billing structure applied to software.
Microsoft announced on January 16, 2025 that it was including Copilot AI features in Microsoft 365 for individual consumers and raising U.S. subscription prices by $3 per month. It was the first Microsoft 365 Personal and Family price increase in twelve years (Reuters; The Verge). Copilot Pro remained $20 per month, so the same capability set moved from a $20 upsell to a $3 embedded increase. Microsoft then announced commercial price changes effective July 1, 2026, applying globally with local adjustments, on Microsoft 365 offerings serving more than 430 million users. More than 90% of Fortune 500 companies use Microsoft 365 Copilot (Microsoft).
Google Workspace lists Starter at $7 per user/month standard, Standard at $14, Plus at $22, and Enterprise as "Let's talk," each with a discounted promotional price for the first year. Starter explicitly includes "Gemini AI assistant in Gmail," "Chat with AI in the Gemini app," and "Google Vids AI-powered video creator and editor" (Google Workspace). The promotional price applies only to the first 20 users for 12 months. The step-up to the standard price is baked into the pricing page itself.
Those three pricing pages describe one behavior. AI capability is not being sold as a separate product with its own gross margin. It is being embedded into everything a knowledge worker already pays for, with the price increase for AI hidden inside the general subscription price. When Microsoft raises prices in the U.S. for the first time in twelve years and bundles AI in, the "will AI raise SaaS prices" question has already been answered. It was answered on 430 million seats.
Under the SaaS pricing, one more index matters. The BLS Producer Price Index for Data Processing, Hosting and Related Services (NAICS 518210) stood at 124.178 in July 2026, up from 122.695 in April (FRED). The direction is unmistakable. Producer prices for hosting are rising while token prices fall. The commodity is deflating at the model layer. The infrastructure is inflating at the delivery layer. That divergence is the operational form of the whole thesis.
The full chain, stated plainly
Here is the full pass-through chain, with sources and no hedging.
Step 1. Data centers are reversing two decades of flat US electricity demand (Dallas Fed WP 2606). The five-year forecast has risen six-fold (Grid Strategies). Berkeley Lab projects 11.8% of U.S. electricity going to data centers by 2030 (LBNL).
Step 2. The build cannot keep up. JLARC in Virginia says building for unconstrained demand "will be very difficult to achieve" (Virginia JLARC). PJM auctions clear at the cap three years in a row (PJM Inside Lines; NRG). Ireland's grid operator closes Dublin (Data Center Dynamics). Amsterdam and Singapore convert moratoria into permanent standards (Data Center Dynamics; Data Center Dynamics).
Step 3. Local governments say no. Heatmap counts 500+ jurisdictions actively restricting or blocking (Heatmap News). Our SAVRN tracker counts 194 verified local moratoria at the state and local level combined (SAVRN Tracker; update). Michigan cancels 71% of projects. Indiana 56%. The interconnection queue in Texas contains 1,800+ projects under audit (SAVRN Tracker).
Step 4. State regulators re-price large loads. Oregon: 29.7% differential (OPB). Virginia: new GS-5 class (Inside Climate News). New Jersey: Fair Share Act (New Jersey Governor's Office). Louisiana: full cost recovery (Louisiana Governor's Office). Ohio: Schedule DCT (AEP Ohio). Georgia: 9,985 MW backstop (Georgia PSC).
Step 5. Residential bills rise anyway. Dominion residential customers pay $11.24 more per month in 2026 plus $2.36 in 2027 (SELC). A Manassas homeowner receives a $281 bill (Consumer Reports). CPI electricity runs 4.2% against 3.4% headline (BLS). Goldman models a 6% additional household increase through 2027, with 0.1 point on core inflation "as businesses pass on higher costs to consumers" (CNBC).
Step 6. AI capability itself becomes utility-priced. Salesforce Agentforce at $2/conversation with non-rollover credits and in-arrears billing (Salesforce). Microsoft 365 raises prices for the first time in twelve years, embedding AI (The Verge). Google Workspace lists step-ups to standard pricing after promotional periods (Google Workspace). BLS PPI for data processing continues to climb (FRED).
Step 7. The receipt lands at the checkout counter. Every service that runs on electricity is now priced on top of an electricity input that is inflating faster than the general price index. Refrigeration in a supermarket. Hot-water heating in a laundromat. Vacuum motors and dryers in a car wash. Cooking equipment in a diner. Every service that adds AI to its operations is now priced on top of a Salesforce, Microsoft, or Google subscription whose AI capability is being metered and repriced. Customer service, scheduling, price optimization, inventory forecasting, driver dispatch, appointment reminders. The chicken, the shoes, the haircut, the car wash. Those are the receipts I named when I started this essay, and every one of them sits at the end of Step 7.
The receipt is where a real-terms cost curve terminates.
Seven steps from a load forecast to a line on a receipt.
Each step is sourced in the text above. Read left to right: the receipt is where a real-terms cost curve terminates.
1. Demand
Data centers are reversing two decades of flat US electricity demand; the five-year forecast rose six-fold.
2. Supply lag
JLARC: unconstrained demand “very difficult to achieve.” PJM clears at the cap three years running. Dublin closes.
3. Local refusal
500+ jurisdictions restrict; 194 verified local moratoria; Michigan cancels 71% of contested projects.
4. Re-pricing
Oregon 29.7% differential; Virginia GS-5; New Jersey Fair Share; Ohio Schedule DCT; Georgia backstop.
5. Household bills
$11.24 more per month in Dominion territory; a $281 bill in Manassas; CPI electricity 4.2% vs. 3.4% headline.
6. AI priced by use
Agentforce $2 per conversation; Microsoft 365 first increase in twelve years; Workspace promotional step-ups.
7. The receipt
Refrigeration, hot water, dryers, dispatch, scheduling: every service priced on top of inflating electricity and metered AI.
Itemized. Every line is sourced in Part Four.
The receipt is not a metaphor. It is where a real-terms cost curve terminates. These are the numbers the essay traces from the load forecast to the household and the software seat.
What SAVRN Builds Because of All Three Claims
The constraints write the design brief
Put the three claims together. Models are a commodity. Unit cost is deflating 5-10× per year. Capability converges within four months and eight ECI points. The leading closed labs are open-weighting their models. Value is in the harness. That is where 34-to-48-point performance swings live on identical model weights. It is where two-thirds of enterprise leaders report data as the primary obstacle. It is where the fastest-growing line item at the most valuable AI lab is a scaffold. And the infrastructure envelope is closing. There are 194 verified state-and-local moratoria, 500+ restrictive local jurisdictions, three consecutive PJM cap-clearings, and a specific engineering demand: no municipal water, on-site power, and property-line acoustic compliance often written to 60 dBA with dBC and octave-band verification.
I read that as a design brief for a company. The brief is:
Build AI factory infrastructure that (a) is model-neutral because the model is a commodity input, (b) monetizes the harness because that is where the value is, and (c) is welcomable in the political environments where wire and water are constrained because those are the environments that will still say yes.
That is the brief I built SAVRN to fill. Every project in our knowledge wiki is a specific answer to a specific line in it.
The physical layer: welcomed infrastructure
Our R1 AI Factory thesis targets R1 universities and municipalities as counterparties. They are politically durable host partners. Their local legitimacy can support long-duration capital formation. The front-of-house Training Institute plus the back-of-house compute layer converts permitting friction into local support. It puts real people to work inside the building and produces measurable community benefit.
Set that against the moratorium data. Independence County, Arkansas passed a five-year moratorium on data centers with no data center proposed, because residents were worried about water. What would Independence County say to a project that: (a) uses direct-to-chip cooling that does not consume municipal water; (b) operates on on-site power that does not draw from the community grid; (c) meets a 60 dBA property-line limit under dBC and octave-band; and (d) opens a Training Institute that puts local people to work?
The question answers itself. No Independence County Quorum Court has ever received that proposal. We designed SAVRN to submit it.
The Sovereign Private Network is the network pillar of the same thesis. Enterprise workloads run on privately operated rack capacity inside a closed, tenant-controlled environment, not through public-cloud-style shared fabric. R1 is a single-institution deployment. It has dedicated bare-metal GPU nodes, a closed private network, a campus data boundary, tenant-held keys, and no co-resident third-party traffic. Kubernetes, the NVIDIA GPU Operator, and Run:ai provide orchestration without adding a VMware-, OpenStack-, or Nutanix-style tenancy layer. Local-first, deny-by-default operation makes local runtime the default and denies external-provider egress. Air-gap claims require an acceptance package. We describe nothing as air-gapped until its disconnected-operation acceptance is complete and approved.
Now set that against Claim I. If models are a commodity, the shape of the compute enclosure becomes the differentiator. The Sovereign Private Network converts commodity model access into a defended enterprise IP position. The enterprise data, the retrieval index, and the tenant-held keys never leave the campus. Anthropic, OpenAI, and any open-weight vendor become interchangeable suppliers behind that boundary.
The financing layer: not the traditional data center capital stack
Our AI Factory Financing Stack is structured around construction, CTL/RVI, and taxable bond takeout. It is not the traditional hyperscaler REIT or private-credit path. University and municipal counterparties as anchors make that stack fundable in a way the pure-speculative capacity stack is not. Consider Georgia PSC's 9,985 MW backstop. Georgia Power is now on the hook to pay for generation if data center contracts fail to materialize. When utilities are contracting for backstop risk, the ability to bring a signed counterparty (a university, a city, a state institution) is worth basis points on the financing.
The operating layer: agents on top of the harness
Our Agent Operating System, the DNA Factory, the ERP/CRM Agent Cell, and the Memory Platform are our internal proof that the harness thesis is architecturally sound. The DNA Factory is the governed artifact, decision-DNA, evaluation, and training pipeline. It keeps outputs traceable to specifications and human approvals. The 14-agent ERP and CRM cell shows that a fleet of specialist agents, with named ownership and exception-based escalation, can operate a real business function. The Memory Platform provides one server-side Memory/Data API. The embedded browser agents, the Claude Code path, and the shared business-data surfaces all use it. The organization does not fragment into local copies.
Any customer of our platform gets the same architecture. The Signal telemetry layer carries first-party engagement data through SAVRN-owned tokens. Outbound links, proposals, NDAs, portals, and work orders show opens, page views, forwards, work-order events, and agent-triggered alerts inside the platform. Project Nest is our white-label operating product. It brands the significant parts of the platform around each facility and investor while preserving operator controls. The Collaboration Layer turns communications into a workstream command surface tied to platform objects and agent actions. It is not a generic Slack clone.
Hold all of that against the LangChain State of Agent Engineering data: 94% observability, 77.2% actual evaluation. The harness maturity gap is our opportunity. Every SAVRN Platform module named in this section is a specific answer to something enterprises say, in survey data, they cannot do on their own.
Case study: applying the design brief to a real ordinance
Take a specific ordinance and walk through how a facility we design answers it. Charlestown, Rhode Island passed a zoning ban on August 11, 2026. The vote was 5-0. It prohibits data centers and battery energy storage systems townwide, citing "reliance on well water and septic systems" (SAVRN Tracker update 2026-08-17). A hyperscale operator cannot design around this type of ordinance. It is a categorical prohibition driven by an infrastructure fact: the town's water and wastewater aren't municipal. No amount of tax abatement or community benefit agreement will fix that.
Our answer to Charlestown is: do not site here. The Sovereign Private Network thesis works because it targets host communities where the physical infrastructure can support a facility that meets the specifications we have agreed to. Charlestown's water and sewage infrastructure cannot. That is a valid "no," and the correct response is to respect it.
Contrast Charlestown with Independence County, Arkansas's five-year moratorium (SAVRN Tracker update 2026-08-17). The county cited water supply strain. The county has no data center proposed. Independence County does have physical infrastructure that could support a facility that used no municipal water. That is a moratorium our proposal could meaningfully address. The proposal would arrive with a direct-to-chip cooling design, an on-site power source, a Training Institute component, and a 14-year utility commitment framework already documented. The five-year moratorium becomes the study period. During it, the county can evaluate exactly that kind of proposal against the case it feared.
Contrast both with Prince William County, Virginia's July 7, 2026 denial of the Dulles Cloud South data center rezoning. The vote was 8-0 against nearly 2,000 acres for a 43 million square foot campus, days after the Digital Gateway project collapsed (SAVRN Tracker). Prince William did not enact a moratorium. It rejected a specific project on a specific site. A jurisdiction that has already been through the Tanner Way noise failure is in a different mood than one that has not. The next data center proposal in Prince William County must be designed from the ordinance backwards. Start with what the county learned it had failed to require in 1989. Work forward through cooling design, siting, and operator commitments.
The pattern across all three cases is the same. Read the ordinance. Match the design. If the match is not there, respect the "no." That is the discipline the moratorium wave forces on any operator that intends to still be building in five years. It is the discipline we run on.
The commercial layer: work credits and the token unit
SAVRN Work Credits are a prepaid enterprise usage unit for AI work. Not for tokens. Not for seats. For verified units of completed work. That commercial abstraction is a direct response to Salesforce Agentforce's $2/conversation and Microsoft's embedded Copilot pricing. The industry is metering AI one step above the model. Our Work Credit is the same idea, one further step up. It is metered at the level of a completed enterprise deliverable, priced against a defined artifact spec, and backed by the DNA Factory's evaluation trace.
Our Telco Token Platform extends the same primitive into governed carrier AI tokens paired with five-year equipment leasing. It is a specific application of the Work Credit unit inside a regulated industry with real capital-cycle needs.
The workforce layer: turning permitting friction into political capital
Our Training Institute is the workforce anchor. National AI-infrastructure workforce and curriculum, tied to a public R1 university, produces a specific and measurable community benefit: real jobs, real credentials, real people employed in the industry being permitted at the local level. The reason this matters is Good Jobs First's number: $1.95 million in subsidies per job across data center megadeals (Good Jobs First). A council member reading that number and looking at a hyperscale proposal with a handful of operator jobs has a hard political case to make. A council member looking at a proposal with a Training Institute that credentials local workers into AI-infrastructure careers has an entirely different case.
That difference is what we mean by "the AI factory a community is proud to host." It is not a slogan. It is an architectural response to the exact political variable driving the moratoria.
Every constraint in Part 3 is a line in the SAVRN design brief.
Left, the constraint as the ordinances and orders write it. Right, what we build against it.
| Constraint | As the ordinance writes it | What SAVRN builds |
|---|---|---|
| Water | Independence County: 5-year moratorium over water supply; SC H 4583 closed-loop by statute | Direct-to-chip cooling; no municipal water |
| Noise | Edgecombe 60 dBA at the property line; York County dBC and octave-band; Prince William’s 1989 gap | Designed to 60 dBA property line, verified in dBC and octave band |
| Power | Louisiana, New York, New Jersey, Oregon, Texas, Ohio DCT: fund your own load | On-site, curtailable, funded by the load; 14-year commitment framework |
| Community benefit | Good Jobs First: $1.95 million in subsidies per job | A Training Institute inside the building; the R1 university as host |
| Enterprise IP | Commodity model access; value in the harness | Sovereign Private Network: tenant-held keys, campus data boundary, deny-by-default egress |
| Metering | Agentforce per conversation; Copilot embedded in the seat price | Work Credits: metered per verified unit of completed work |
The claim, restated
None of the constraints in Part III is a threat to SAVRN. Each one is a specification for SAVRN. Water: direct-to-chip. Noise: designed to 60 dBA property line, verified in dBC and octave-band. Power: on-site, curtailable, funded by the load. Community benefit: a Training Institute inside the building. Enterprise IP: a Sovereign Private Network with tenant-held keys. Data organization: the Memory Platform. Evaluation: the DNA Factory. Metering: the Work Credit. Sales, telemetry, communication, collaboration, publishing: platform-native, first-party, agent-observable.
Our brand promise, "the AI factory a community is proud to host," is the sentence that captures all of it. It is a business model designed for the world Part III describes. It runs on the harness architecture Part II demands. It sits on top of the commodity model layer Part I permits. Every claim in this essay is answered by a specific SAVRN project.
Objections, and the Case Against the Case
The strongest version of any thesis engages the strongest version of its opposition. Six objections deserve direct treatment. I take them in turn.
Objection one: "The moratorium wave will pass. Communities always come around."
The European precedent argues the opposite. Amsterdam's moratorium converted into permanent PUE limits and a 70 MW national cap. Singapore's pause converted into 5-MW selective allocation. Ireland's Dublin refusal sits at the grid, not at zoning, and is projected to run to 2028. American operators who expect the wave to pass are correctly identifying the political cycle and misidentifying its residue. Moratoria settle into permanent performance standards. A facility that is not designed to those standards will not be built again in that jurisdiction.
Objection two: "Data centers have historically lowered rates, not raised them."
The instrumental-variables paper by Watten, Bistline, and Blanford finds exactly that for 2015–2024. The paper's own caveat is that "future supply constraints could reverse the effect" (arXiv 2606.19777). The Dallas Fed's 2026 dispatch model works forward from current supply constraints. It finds a 3-to-5% wholesale increase attributable to existing data centers, and 20-to-50% by 2028 from what is under construction. Historical scale economies were real. Forward-looking capacity scarcity is what changed. Both things are true at once.
Objection three: "The model is not commoditized. Buyers report switching cost."
The a16z 2025 Enterprise report says exactly this (a16z). Look at the evidence a16z presents: tuned prompts, workflow embedding, agentic fine-tuning. Every one of those is switching cost accumulated by the buyer, in the harness, around a fungible model. That is the harness thesis offered as evidence against itself. The commodity is model access. The sticky asset is the buyer's own harness. In a market where costs fall by an order of magnitude every twelve months and 37% of buyers use five or more models, this is not classical vendor lock-in. It is a stack in which one layer is commoditized and the layer above it is not.
Objection four: "Open-weight models will always trail closed-frontier models on hard tasks."
Epoch AI shows the lag oscillating between three and six months, not widening (Epoch AI). OpenAI itself released gpt-oss under Apache-2.0 at near-parity with its own paid tier (OpenAI). For most enterprise workloads, a three-to-six-month lag on capability is a discount, not a defect. The workloads that require last week's absolute frontier are a minority. Even there, the shape of the lead is a rolling lease, not a permanent moat.
Objection five: "SAVRN's positioning depends on universities and cities as anchors. That is not scalable."
R1 universities in the United States number over 130. Cities with populations above 100,000 number over 300. State-level educational institutions in aggregate number in the thousands. That is not a small addressable market. What does not scale is the individual project. Every campus is bespoke. I consider that a feature, because bespoke is what converts permitting friction into political durability. The Compass Austin project, the Radford-Wythe power development concept, the Philippines Strategic Capital project, and the CleanFlex Nexus tax-incentive package are the same core pattern applied to different anchor types.
Objection six: "Consumers will not tolerate rising costs. There will be a political correction."
There already has been a political correction. It is called the moratorium wave. Its second-order effect is separate rate classes that make data centers pay their own way and, in Oregon's case, cut residential bills. That is the correction. What the correction does not do is push the cost back onto the data center's balance sheet without a receipt attached. It pushes the cost into the price of the AI service the data center exists to sell. The Manassas homeowner's $281 bill is real. The political correction to it is a $16 monthly reduction in his exposure through a new GS-5 class, offset by a general residential rate case increase of $11.24. Net-net, his bill still rises. The mechanism has simply moved to the SaaS subscription and the price of the chicken.
The correction did not eliminate the pass-through. It reshaped it.
What This Essay Is Not
This essay is not opinion. Every number in it is sourced, and every source is linkable. The SAVRN moratorium tracker is neutral by design. It lists what governments did, with a primary source for each entry, and it does not tell the reader what to think about what governments did. This essay reads the neutral tracker and builds a thesis on top of it.
That thesis is not a prediction. It is a description of a mechanism that is already running. The mechanism is (a) commodity intelligence, delivered through (b) differentiated harness architectures, which need to sit inside (c) constrained physical infrastructure. The delivery costs of that infrastructure land, through utility rate structures and SaaS pricing, at the checkout counter of an economy that runs on electricity and information.
The prediction that follows from the mechanism is unremarkable. The price of AI-touched services will rise faster than headline inflation for the remainder of this decade. The winners at the operator layer will be the ones whose infrastructure is welcomable, because the ones whose infrastructure is not welcomable will not be built.
The counter-argument to that prediction is not that it is wrong. It is that it is convenient. It happens to align with what SAVRN was built to build. That is a fair objection to raise, and my answer is: yes, it does. That is why I built SAVRN. If the thesis were wrong, the company would not exist.
I invite the reader to check the assembly. Read the tracker. Read the ordinances and the rate cases. Read the Federal Reserve working papers, the Berkeley Lab study, and the auction reports. Read the a16z report, the McKinsey survey, the BCG value-gap paper, and the arXiv scaffold-variance study. If any step fails, the thesis fails.
If every step holds, the thesis holds. And the moratorium tracker becomes the most consequential neutral document in the AI infrastructure debate, not because it takes a side, but because it names the constraint.
Field of Dreams
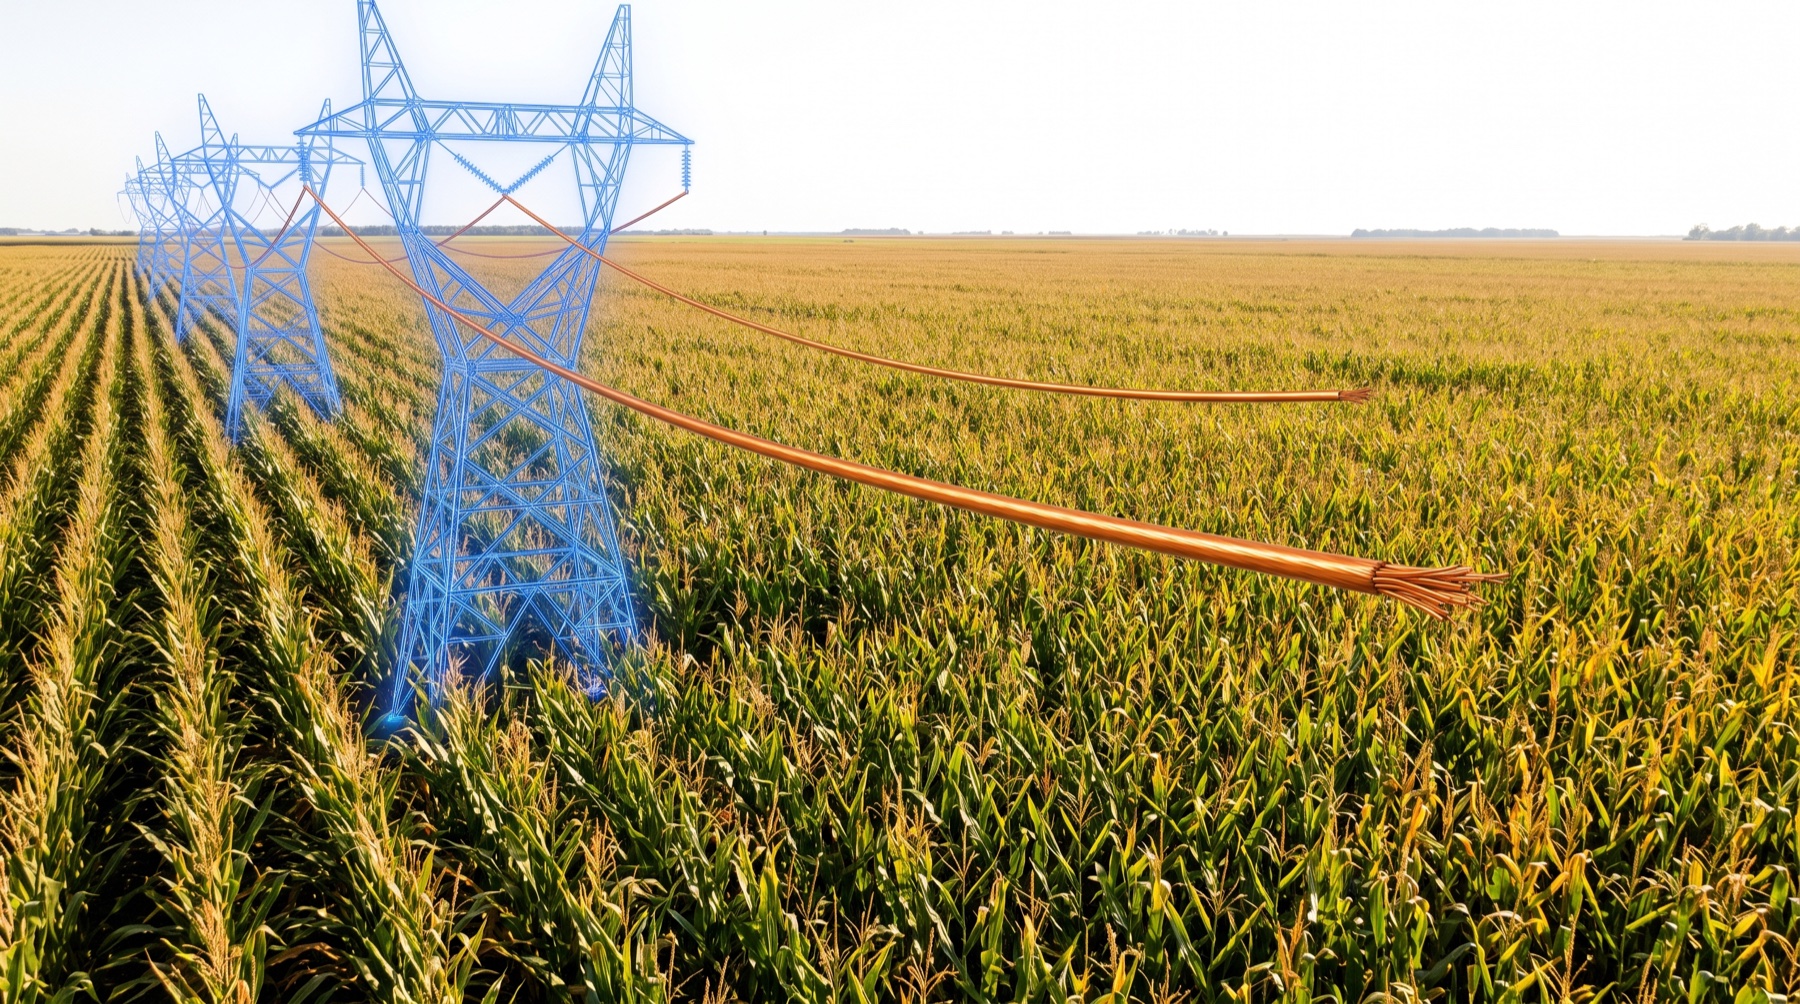
John Steinbach of Manassas, describing his neighbors' view of the data center build-out: "They're building them like it's 'Field of Dreams' (build it and the electricity will come) but we don't see how that's going to happen." (Consumer Reports)
Steinbach's point is that his neighbors do not see how the electricity will come. Grid Strategies' point is that the five-year forecast broke six-fold in three years. JLARC's point is that meeting even half of Virginia's unconstrained demand would take one 1,500 MW gas plant per year for fifteen consecutive years. PJM's point is that three consecutive capacity auctions cleared at the regulatory cap. Berkeley Lab's point is that 11.8% of U.S. electricity by 2030 is going to a use case that did not exist at commercial scale five years ago. The Dallas Fed's point is that this reversal of two decades of flat demand has already raised wholesale prices 3 to 5%, and will raise them 20 to 50% by 2028.
The electricity is not going to come the way it did last time. It is going to come the way it can come: on-site, curtailable, funded by the load, monitored by the community, cooled without municipal water, and quiet enough to sleep next to. That is a design brief. That brief is what I built SAVRN to deliver.
The model is a commodity. The harness is where the value is. The infrastructure is where the fight is. The receipt lands at the checkout counter.
Nobody will argue with this statement.
And if they do argue with it, they will be arguing it from their cell phone using Siri.
Questions this raises
What does “the model is no longer the moat” mean?
Frontier closed models and the best open-weight models now score within a few points of each other. Stanford’s AI Index measured the closed-versus-open gap on Chatbot Arena at 8.04% in January 2024 and 1.70% by February 2025. Epoch AI puts the open-weight lag at about four months and eight capability-index points. When capability converges and prices fall 5–10× a year, the model becomes a substitutable input rather than a defensible advantage.
What is an AI “harness,” and why does it matter more than the model?
The harness is everything around the model: the loop, the tools, the memory, the context, the evaluation, and the enterprise data behind it. Simon Willison’s definition of a coding agent is “LLM + system prompt + tools in a loop.” On the GAIA benchmark, the same Claude Sonnet 4.5 scores 30.91% in one scaffold and 74.55% in another. The harness, not the weights, drove that 43-point difference.
How many places have restricted data centers?
As of the August 17, 2026 refresh, the SAVRN Data Center Moratorium Tracker verifies 45 state-level measures across 36 states and 194 local jurisdictions, with 230 primary sources. Heatmap News, using a broader definition, counts more than 500 counties and municipalities restricting or blocking new data centers. The tracker is a lower bound.
Are the moratoria temporary?
The European precedent says no. Amsterdam’s 2019 ban converted into permanent PUE and capacity limits. Singapore’s pause ended with selective allocation at roughly 5 MW increments. Ireland’s grid operator will accept no new Dublin data center connections until possibly 2028. Temporary moratoria settle into permanent performance standards.
What are the three physical constraints the ordinances cluster around?
Noise, water, and power. Noise is written as decibel limits at the property line, often 60 dBA with dBC and octave-band verification. Water is written as reporting mandates and, in South Carolina, closed-loop cooling by statute. Power is written as “bring your own”: fund the incremental generation, transmission and grid upgrades, or curtail first, or pay a separate large-load rate.
How do data centers raise a household’s electricity bill?
The utility builds capacity to serve the load and recovers the cost from its rate classes. Unless a state creates a large-load class that pays its own way, residential customers carry part of the cost. The Dallas Fed models a 3–5% wholesale increase already attributable to existing data centers and 20–50% by 2028. Dominion’s November 2025 order raised typical residential bills by $11.24 a month in 2026 while creating a new large-load class.
What is the PJM capacity auction, and why does it matter here?
PJM runs the wholesale market for 67 million people in 13 states and D.C. Its annual capacity auction sets the price generators are paid to commit capacity three years out. The price rose from $28.92 per MW-day to $269.92, then cleared at the FERC-approved cap three consecutive years, at $16.4 billion in the 2027/28 auction. A capped price is a regulatory ceiling, not a market price.
What is Dominion’s GS-5 class?
A new large-energy-user rate class the Virginia SCC created in its November 25, 2025 order, effective January 1, 2027. It captures customers at 25 MW demand and 75% load factor, requires 14-year contracts, and requires payment of at least 85% of transmission and distribution costs and 60% of generation costs of contracted need. It is a template other commissions can copy.
How does the cost reach the checkout counter?
Two channels, then a third. Electricity enters the general price level through the utility bill and through every business that runs on electricity, which Goldman Sachs models as roughly 0.1 point on core inflation “as businesses pass on higher costs to consumers.” The third channel is AI itself, now priced by usage: Agentforce at $2 per conversation, Copilot embedded in a Microsoft 365 price increase, Workspace with step-ups to standard pricing after promotional periods.
What does SAVRN build because of this?
Model-neutral AI factory infrastructure that treats the model as substitutable inference capacity, monetizes the harness through the Agent Operating System, DNA Factory and Work Credits, and is designed to be welcomed where wire and water are constrained: direct-to-chip cooling without municipal water, on-site curtailable power funded by the load, 60 dBA property-line acoustics verified in dBC and octave band, and a Training Institute inside the building, with R1 universities and municipalities as host counterparties.
Sources
Standalone sources pageEvery source on one page: grouped, linked, citableEvery figure in this essay is linked inline to its source at the point of use; this list collects them once. The SAVRN Data Center Moratorium Tracker is cited throughout as the neutral record: it lists what governments did, with a primary source per entry, and refreshes every Monday. Before publication each link was checked live and each cited number was compared against its source; the corrections that check produced are already reflected in the text.
- Consumer Reports · consumerreports.org
- SAVRN Data Center Moratorium Tracker, August 17, 2026 update · savrn.com
- Epoch AI · epoch.ai
- Stanford HAI AI Index 2025 · hai.stanford.edu
- arXiv 2511.23455 · arxiv.org
- Princeton HAL · hal.cs.princeton.edu
- arXiv 2605.23950 · arxiv.org
- Anthropic · anthropic.com
- SAVRN Tracker · savrn.com
- Heatmap News · heatmap.news
- PJM Inside Lines · insidelines.pjm.com
- NRG · nrg.com
- Southern Environmental Law Center · selc.org
- BLS · bls.gov
- LMArena · arena.ai
- Epoch AI · epoch.ai
- OpenAI · openai.com
- Artificial Analysis · artificialanalysis.ai
- Qwen release blog · qwenlm.github.io
- DeepSeek · api-docs.deepseek.com
- Stanford HAI AI Index 2025 · hai.stanford.edu
- Yahoo Finance · finance.yahoo.com
- Engadget · engadget.com
- Menlo Ventures · menlovc.com
- a16z · a16z.com
- Anthropic · anthropic.com
- Anthropic · anthropic.com
- Simon Willison · simonwillison.net
- Simon Willison · simonwillison.net
- Anthropic · anthropic.com
- Constellation Research · constellationr.com
- Glean · glean.com
- McKinsey · mckinsey.com
- BCG · media-publications.bcg.com
- LangChain · langchain.com
- MultiState · multistate.us
- NCSL · ncsl.org
- New York Governor's Office, EO 62 · governor.ny.gov
- Route Fifty · route-fifty.com
- Louisiana Governor's Office · gov.louisiana.gov
- Lexington KY News · lexingtonky.news
- Utility Dive · utilitydive.com
- Virginia Mercury · virginiamercury.com
- Virginia JLARC Report 598 · jlarc.virginia.gov
- OPB · opb.org
- New Jersey Governor's Office · nj.gov
- MultiState · multistate.us
- Georgia PSC · psc.ga.gov
- AEP Ohio · aepohio.com
- Data Center Dynamics · datacenterdynamics.com
- Citizen Portal, Edgecombe County · citizenportal.ai
- York County · ycpc.org
- EESI · eesi.org
- arXiv 2304.03271 · arxiv.org
- NCSL · ncsl.org
- Data Center Dynamics · datacenterdynamics.com
- Data Center Dynamics · datacenterdynamics.com
- Data Center Dynamics · datacenterdynamics.com
- Good Jobs First · goodjobsfirst.org
- Dallas Fed WP 2606 · dallasfed.org
- Reuters · reuters.com
- PJM 2027/2028 BRA Report · pjm.com
- Grid Strategies · gridstrategiesllc.com
- LBNL · datacenters.lbl.gov
- IEA Energy and AI, Executive Summary · iea.org
- Goldman Sachs · goldmansachs.com
- CNBC · cnbc.com
- Bloomberg · bloomberg.com
- Inside Climate News · insideclimatenews.org
- E3 · ethree.com
- arXiv 2606.19777 · arxiv.org
- Salesforce · salesforce.com
- Reuters · reuters.com
- The Verge · theverge.com
- Microsoft · microsoft.com
- Google Workspace · workspace.google.com
- FRED · fred.stlouisfed.org