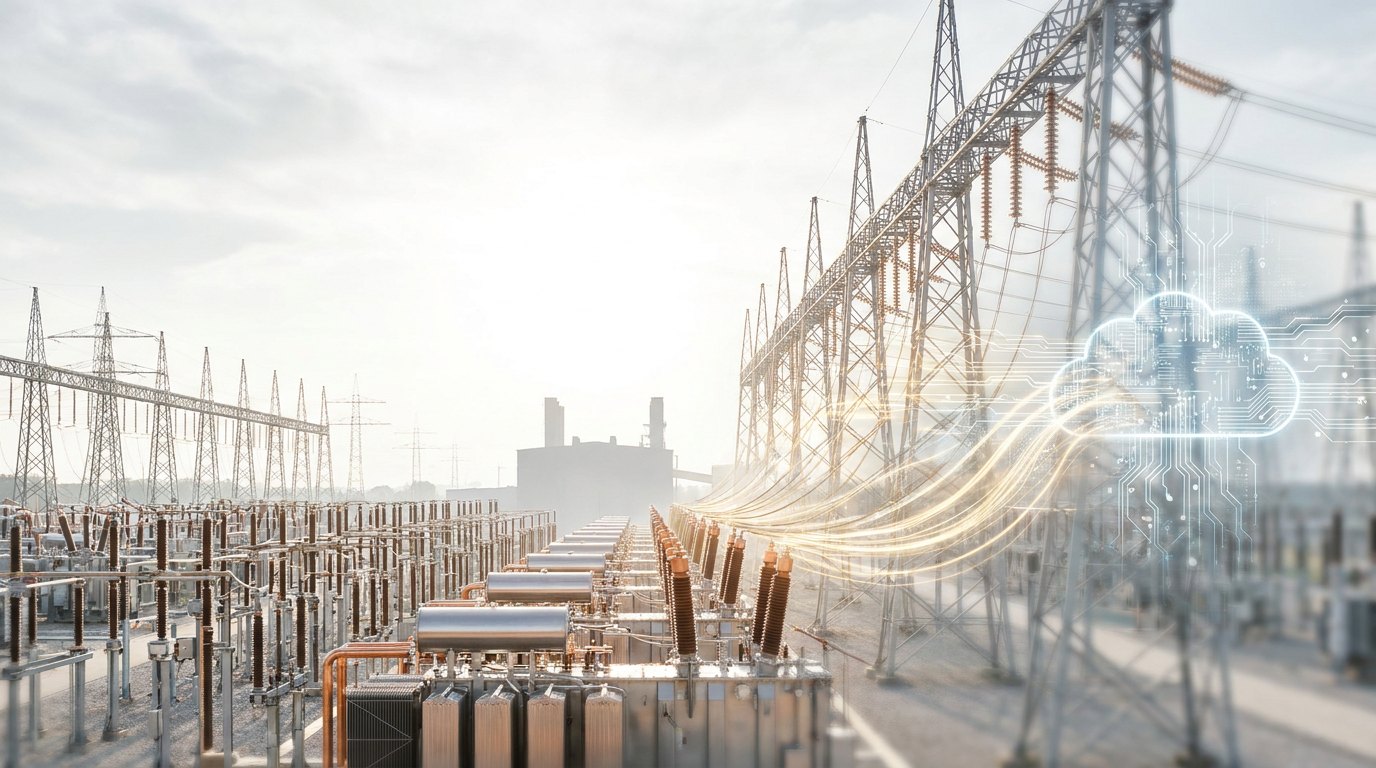
The Physical Power CrunchWhy AI's real bottleneck is steel, not silicon
The AI race is being reported as a contest of chips and capital. On the ground where the power actually gets built, it is neither. The binding constraint through 2028 is a turbine that ships in 2029, a transformer that takes three years, and a grid queue where only one project in eight is ever built. This is a field report on the wall the boom just hit — and the one way through it.
 Chad Everett HarrisFounder, SAVRN
I have spent a career moving electricity to places that did not have enough of it. You learn a habit doing that work: before you believe any plan, you find the physical thing it depends on and you ask when it actually arrives. Not when the press release says. When it is bolted down, energized, and carrying load.
Run that habit over the AI buildout and the story the market is telling itself falls apart. The headlines are about GPUs and model weights and hundred-billion-dollar capex. Those are real. But none of them is the thing the schedule actually turns on. The thing the schedule turns on is a small number of unglamorous machines — turbines, transformers, switchgear — and a line at the utility that money cannot move you up. Every one of them is backlogged years past the moment the compute is supposed to switch on.
Here is the claim, stated plainly enough to be wrong if it is wrong: the binding constraint on U.S. AI capacity through 2028 is not chips, capital, or land. It is the physical delivery of electric power. And unlike the other constraints, this one does not yield to a bigger check. It yields to one decision, made early, that most developers are not structured to make.
What follows is the evidence, including the parts that cut against the neat version of the story.
The demand is real — and partly imagined
Start with the number everyone leads with, because it is the weakest part of the argument and I would rather disarm it than lean on it.
The demand is genuinely large. The U.S. Energy Information Administration — not a forecaster with an incentive to hype — reports U.S. electricity load grew about 1.7% a year from 2020 to 2025, after fifteen years of essentially flat demand near 0.1%, and projects 1.9% in 2026 and 2.5% in 2027, with data centers the primary driver.1 The International Energy Agency puts global data-center electricity roughly doubling to about 950 terawatt-hours by 2030.2 The Electric Power Research Institute's scenarios have U.S. data centers reaching 9% to 17% of national electricity by 2030, up from four or five today.3
Now the honest part. The eye-watering forecasts — the ones that put another two or three hundred gigawatts on the grid this decade — are inflated, and the people closest to the data say so. Grid Strategies, in its 2025 national load-growth report, found utilities' aggregated data-center forecasts overstated by as much as 40% against independent analyst estimates.4 The mechanism is simple and well documented: a single campus files interconnection requests across several utilities at once, so the same project is counted three or four times. Analysts put speculative and duplicate requests at five to ten times the facilities that will actually be built.5 PJM, the largest grid operator, quietly trimmed its own near-term forecast after tightening how it vets data-center load.6
Source: Grid Strategies, National Load Growth Report 2025 — utility-aggregated data-center forecast vs. independent analyst estimates.
The forecast is inflated. It does not matter. Even the deflated number outruns what the grid can physically add.
I am dwelling on this because it is where a careful reader would attack, and the attack fails in an instructive way. Suppose the true number is not the utility aggregate but the analysts' figure — call it a third smaller. The argument does not weaken. Because the case I am about to make is not that demand is infinite. It is that supply cannot be added fast enough to meet even the conservative number, on the timeline the capital assumes. The demand debate is a sideshow. The supply side is where the schedule actually breaks.
The queue is a graveyard, not a pipeline
To connect new power to the grid — whether you are building the generation or the load — you join an interconnection queue. People picture a queue as a line that moves. This one mostly does not.
Lawrence Berkeley National Laboratory tracks it precisely. At the end of 2025, about 2,061 gigawatts of generation and storage were sitting in U.S. interconnection queues — more than twice the entire installed capacity of the country, waiting to connect.7 That sounds like abundance. It is the opposite. Of all the capacity that entered those queues between 2000 and 2020, only about 13% ever reached commercial operation. Roughly three-quarters withdrew.7 The line is not a pipeline filling up. It is a graveyard filling up.
And it is slow. For projects that did reach operation in 2025, the median time from interconnection request to switching on was about 61 months — just over five years — and roughly 45 months of that just to reach a signed agreement. That figure has risen every year for two decades.7
Source: Lawrence Berkeley National Laboratory, Queued Up — median time from interconnection request to commercial operation, by completion year.
Sources: Lawrence Berkeley National Laboratory, Queued Up: 2026 Edition; PJM Interconnection.
PJM redesigned its whole process to fix this, moving to a "first-ready, first-served" model. It helped clear the backlog — 811 projects totaling 220 gigawatts applied in the first cycle, of which 715 and 201.5 gigawatts were accepted for study.8 But PJM is candid about what clearing the queue does and does not mean. Since 2020 it has processed more than 300 gigawatts of projects; only 103 gigawatts reached signed agreements, and PJM says many even of those "are either not being built at all or are being slowed by permitting and supply-chain backlogs."8
Do the arithmetic against a schedule. A project entering a queue in 2026 faces a one-to-two-year study, then construction, against a five-year median. New grid-tied generation cannot energize a campus by 2027 or 2028. The queue has already closed that door. This is the first place the boom's timeline stops being a forecast and becomes a physical impossibility.
The machines that do not exist yet
Say you get through the queue, or you build behind the meter and skip it. You still need the machines. Two of them are the real chokepoints, and both are the kind of heavy industrial equipment that a decade of flat demand taught the world to under-build.
The first is the gas turbine. The three companies that make heavy-frame turbines — GE Vernova, Siemens Energy, Mitsubishi — are effectively sold out for the rest of the decade. GE Vernova ended 2025 with a backlog around 80 gigawatts stretching into 2029, and told investors its slots would be reserved through 2030.9 Siemens Energy is booked out to fiscal 2028, with 2029 and 2030 filling fast; it nearly doubled turbine sales in a single year.10 Mitsubishi's large-frame orders now deliver in 2028 to 2030.11 A large turbine ordered in early 2026 does not run until around 2031 — more than five years — where it was two to three before 2023.12 The price of a slot has roughly doubled, and the OEMs now charge cash reservation fees to hold capacity: two Kentucky utilities paid GE Vernova $25 million to hold a single 2030 slot.13
Sources: GE Vernova, Siemens Energy, Mitsubishi Heavy Industries backlog disclosures, via Utility Dive (Dec 2025 – Aug 2026).
Two utilities paid twenty-five million dollars for the right to wait until 2030 for one turbine.
The second machine is smaller and, if anything, worse. It is the transformer — the unglamorous steel box that steps voltage up from a generator or down into a campus. Nothing connects to the grid without one. In 2020 you could order a large power transformer and have it in six to twelve weeks. Today the lead time is about 128 weeks for a power transformer and 144 weeks for a generator step-up unit — nearly three years.14 Wood Mackenzie modeled a 30% supply deficit for power transformers in 2025 alone.15 Prices are up 45% to 80% since 2019.14
Source: Wood Mackenzie Q2 2025 transformer market survey, via POWER Magazine (Jan 2 2026). Power transformers ~128 weeks; GSU ~144. Bars to scale.
The reason is worth sitting with, because it is the whole crunch in miniature. The United States imports roughly 80% of its large power transformers, and the specialized grain-oriented electrical steel at the core of every one of them has exactly one domestic producer.16 Manufacturers are expanding — Hitachi Energy is building a $457 million transformer plant in Virginia — but it does not come online until around 2028.17 The relief arrives after the deadline it was meant to relieve.
This is the pattern under every line item. It is not that these machines are impossible. It is that the world stopped building the capacity to make them quickly, and you cannot restart heavy manufacturing on the clock of a GPU depreciation schedule. The chips iterate in months. The steel iterates in years. The schedule is set by the slower of the two, and it is not close.
The eighty-two seconds that rewrote the rules
Suppose you have the machines and you have grid access. There is now a third problem, and it is the one that turned regulators from spectators into adversaries of the grid-tied campus.
On July 10, 2024, a fault on a 230-kilovolt line in Northern Virginia set off a sequence — six faults in eighty-two seconds as the line tried to reclose. In response, about 1,500 megawatts of data-center load dropped off the system simultaneously, and roughly 1,260 of those megawatts stayed off for hours. Grid frequency lurched upward. About sixty data centers were involved.18 A grid is a balance between supply and demand held stable every instant; lose that much load in seconds and you are one cascade away from a much larger event. It was not the only such incident — a February 2025 event dropped roughly 1,800 megawatts in the same region.19
The response was structural. In May 2026, the North American Electric Reliability Corporation issued a Level 3 "Essential Actions" alert — its most serious tier — over large computational loads dropping off the system, mandating a set of actions and a status report.20 Its reliability assessment now flags thirteen of twenty-three regions at elevated or high risk within a decade, with PJM and Texas reaching high risk by 2029.21 And the law is moving the same direction: Texas Senate Bill 6 requires large new loads to be curtailable as a condition of connecting at all, and lets the grid operator order them to run their own on-site generation during emergencies.22
The rules now treat a large grid-tied load as a liability to be managed — and reward the campus that can disconnect and power itself.
Read those three moves together — the alert, the risk map, the statute. The regulators have stopped treating a large AI campus as a customer to be served and started treating it as a hazard to be contained. The grid-tied path is not just slow now. It is being actively re-priced against you, in the tariff and in the law. I documented the federal half of this shift separately, in the essay on the August 17 FERC deadline. The through-line is the same: every rule being written rewards the load that can stand on its own.
The only lever you actually control
If the grid is a five-year wait and the rules penalize depending on it, the one variable a developer still controls is whether to generate power on site. That much is obvious. The question nobody expects to be hard is the next one: generate it with what?
We ran that question to the ground for our own campuses, and the answer surprised the people we walked through it. At the scale a single AI block actually needs — call it 15 megawatts on a pad — the default choice is a gas turbine, and the specific default is the GE LM6000. It is a superb machine. It is also the wrong machine at this size, for a reason that has nothing to do with fuel cells being fashionable.
The LM6000 is built to run at 40 megawatts and up. Throttle it down to 15 and its efficiency collapses — from about 41% at nameplate to the low-to-mid 30s at part load. A PEM fuel-cell array fed by on-site steam-methane reforming does the opposite: it holds roughly 40% net efficiency flat, whether you are drawing 5 megawatts or 15, because you add and shed 3-megawatt blocks instead of throttling one big turbine.
SAVRN engineering analysis, LHV net, ISO conditions. A modular fuel-cell array adds and sheds 3 MW blocks; a single LM6000 must throttle one machine, which is why its efficiency falls away from nameplate.
So at 15 megawatts the fuel cell wins on efficiency — not because it is a better converter of fuel (it is not; the reformer that makes its hydrogen quietly eats the same energy the turbine loses to part-load), but because the turbine is being asked to do something it was not built for. Above about 40 megawatts the comparison flips hard: one LM6000 in combined cycle reaches 55%, and no stack of fuel cells and reformers catches that. This is a campus-scale result, not a verdict on the technology.
And efficiency, it turns out, is not even the reason to choose it.
The efficiency was close to a tie. The siting was not.
The real reasons are structural, and they are exactly the constraints Section IV described. A combustion turbine at 15 megawatts emits nitrogen oxides at the stack; it needs an air permit, offsets, and a Title V review that can add a year no one budgeted. The electrochemical path emits none at the stack — nothing is burning — so there is no combustion-source air permit to win. It runs at about 65 decibels instead of 90, quiet enough to site next to the people it employs. It uses a fraction of the water. And it carries an upgrade path a turbine cannot: swap the reformer’s gas-derived hydrogen for delivered clean hydrogen later, and the same stacks decarbonize without touching the plant.
| Metric | Fuel cell + reformer | GE LM6000 |
|---|---|---|
| Efficiency at 15 MW | ~40% LHV, flat | ~30–35% (part-load) |
| On-stack NOx | Zero — no combustion | 15–25 ppm (needs permit) |
| Water use (net) | ~13–15 gpm | ~55–570 gpm |
| Noise at 10 m | ~65 dBA | ~85–90 dBA |
| Air permit | None at stack | Title V likely |
| Footprint | ~15,000–25,000 ft² | ~1,200 ft² |
| Cold start | ~30–45 min | ~5 min |
| Above ~40 MW | — | Combined cycle wins (55%) |
SAVRN engineering analysis at a 15 MW site. Copper marks the winning architecture on each metric. The turbine is smaller and starts faster; the fuel cell wins on everything that decides whether a campus can be sited and permitted near load.
I will be honest about the tradebacks, because they are real. The fuel-cell system is physically larger — thousands of square feet of reformers and stacks against a turbine package the size of a shipping container. It starts in thirty to forty-five minutes, not five. And it is only ever as clean as its hydrogen; on pipeline gas through a reformer, its carbon intensity is roughly the same as the turbine’s. The clean part is a path, not a starting condition. Anyone who sells it as green on day one is selling you the brochure. (There is even a version where carbon capture reverses the ranking again — pulling CO&sub2; off a concentrated reformer stream is far cheaper than scrubbing a turbine’s dilute exhaust — but that is a later essay.)
The one option that would end the whole debate does not arrive in time. Small modular reactors — actual nuclear, a different technology entirely — are real and coming, but the first U.S. commercial units are a 2030s story; the leading approved design targets operation around 2030 at the earliest.24 Nuclear answers the decade. It does not answer the deadline.
Here is the part that matters, and it is not fuel cell versus turbine. It is that we got to make the choice at all. A campus that generates its own power gets to run this comparison, on its own site, on its own timeline, and pick the architecture that fits its constraints — the grid queue never enters into it.23 A campus waiting in line gets whatever the grid hands it, whenever the grid gets to it. The engineering above is worth having only because the decision to own the generation came first.
What the crunch is really about
Step back from the individual numbers and the shape is simple. Every layer of physical power delivery — generation, the queue, the turbine, the transformer, the reliability rules on top — runs on a clock measured in years. The AI capital cycle runs on a clock measured in quarters. When a fast process depends on a slow one, the slow one sets the schedule. That is the whole crunch. It is not a shortage of electricity. It is a mismatch of clocks.
Which means the advantage does not go to whoever has the most capital, or the best chips, or the cheapest headline megawatt. Every serious builder has those, on roughly the same terms. The advantage goes to whoever took the one slow thing off the critical path early — who ordered the transformer eighteen months before they needed it, who built generation at the pad instead of joining the line, who structured the campus so it never had to ask the utility for permission on the utility's timeline.
That is the decision this entire essay comes down to, and it is not a spending decision. It is a design decision, made before the first dollar of compute is committed. The campus that generates its own power never enters the queue it cannot beat, never orders the step-up transformer it would wait three years for, never signs the tariff being rewritten against it, never appears on the reliability map as a hazard. It reads every constraint in this essay as someone else's problem.
The reporting will keep calling this a race for chips. On the ground where the power gets built, it is a race for the slow machines and the early decision. Speed-to-power is the only moat here that compounds — because everyone else is still standing in a line that, three-quarters of the time, ends in a withdrawal.
References
Every quantitative claim in this essay is sourced — 24 in total, grouped by theme. Tap a group to expand it; each source links to the original. A companion research-sources page carries the full record.
AThe demand shock6›
- 1U.S. Energy Information Administration — Today in Energy: data-center power demand and load growth
eia.gov ↗ ↩ back - 2International Energy Agency — Electricity 2026, Demand chapter
iea.org ↗ ↩ back - 3Electric Power Research Institute — Powering Intelligence: U.S. data-center load scenarios
epri.com ↗ ↩ back - 4Grid Strategies — National Load Growth Report 2025
gridstrategiesllc.com ↗ ↩ back - 5Latitude Media — Phantom data centers are flooding the load queue
latitudemedia.com ↗ ↩ back - 6PJM Interconnection — 2026 Load Forecast Report
pjm.com ↗ ↩ back
BThe interconnection queue2›
- 7Lawrence Berkeley National Laboratory — Queued Up: 2026 Edition
emp.lbl.gov ↗ ↩ back - 8PJM Interconnection — Over 800 new generation projects seek to connect under PJM's reformed process
pjm.com ↗ ↩ back
CTurbines and transformers9›
- 9Utility Dive — GE Vernova expects an ~80-GW gas turbine backlog into 2029 (investor update)
utilitydive.com ↗ ↩ back - 10Utility Dive — Siemens Energy's gas turbine backlog nears 70 GW; booked to FY2028
utilitydive.com ↗ ↩ back - 11Utility Dive — Mitsubishi's large-frame gas turbine backlog reaches 35 GW
utilitydive.com ↗ ↩ back - 12Utility Dive — 5-year waits and rising costs: how demand is redefining the gas turbine market
utilitydive.com ↗ ↩ back - 13Latitude Media — Gas turbine prices are up — and aren't going down anytime soon
latitudemedia.com ↗ ↩ back - 14POWER Magazine — Transformers in 2026: shortage, scramble, or self-inflicted crisis? (citing Wood Mackenzie Q2 2025)
powermag.com ↗ ↩ back - 15Wood Mackenzie — Power and distribution transformers will face supply deficits of 30% and 10% in 2025
woodmac.com ↗ ↩ back - 16Utility Dive — Cleveland-Cliffs and U.S. electrical-steel / transformer capacity
utilitydive.com ↗ ↩ back - 17Utility Dive — Hitachi Energy's $1B U.S. grid investment, incl. Virginia transformer plant
utilitydive.com ↗ ↩ back
DReliability and the rules5›
- 18NERC — Incident Review: considering simultaneous voltage-sensitive load reductions (July 10, 2024 event)
nerc.com ↗ ↩ back - 19Utility Dive — Sudden data-center load losses prompt NERC alert and recommendations
utilitydive.com ↗ ↩ back - 20Utility Dive — NERC issues rare Level 3 alert over data-center load losses (May 2026)
utilitydive.com ↗ ↩ back - 21NERC — 2025 Long-Term Reliability Assessment
nerc.com ↗ ↩ back - 22McGuireWoods — Texas Senate Bill 6 expands regulatory oversight over large loads in ERCOT
mcguirewoods.com ↗ ↩ back
EThe on-site response2›
- 23Enverus Intelligence Research — Time to Power: fast-tracking data-center energization in a constrained grid (~5-year interconnection)
enverus.com ↗ ↩ back - 24Utility Dive — NRC approves NuScale small modular reactor design; first plant ~2030
utilitydive.com ↗ ↩ back